
Optimizing Agentic Execution: Putting the Ideas to the Test
An earlier post, Optimization of Agentic Execution, mapped compiler optimizations to agentic execution. Here we evaluate whether six compiler-inspired directives, combined with a Bash-output cap, reduce cost and execution time on the following ten Terminal-Bench 4.0 tasks:
coq-block-boundembedding-drift-monitorrisk-scorer-replaysound-change-cascadelayout-config-recreation2telecom-entity-resolutionretro-console-socpayments-pipeline-fixpretrain-shard-corruptiontakens-embedding-lean
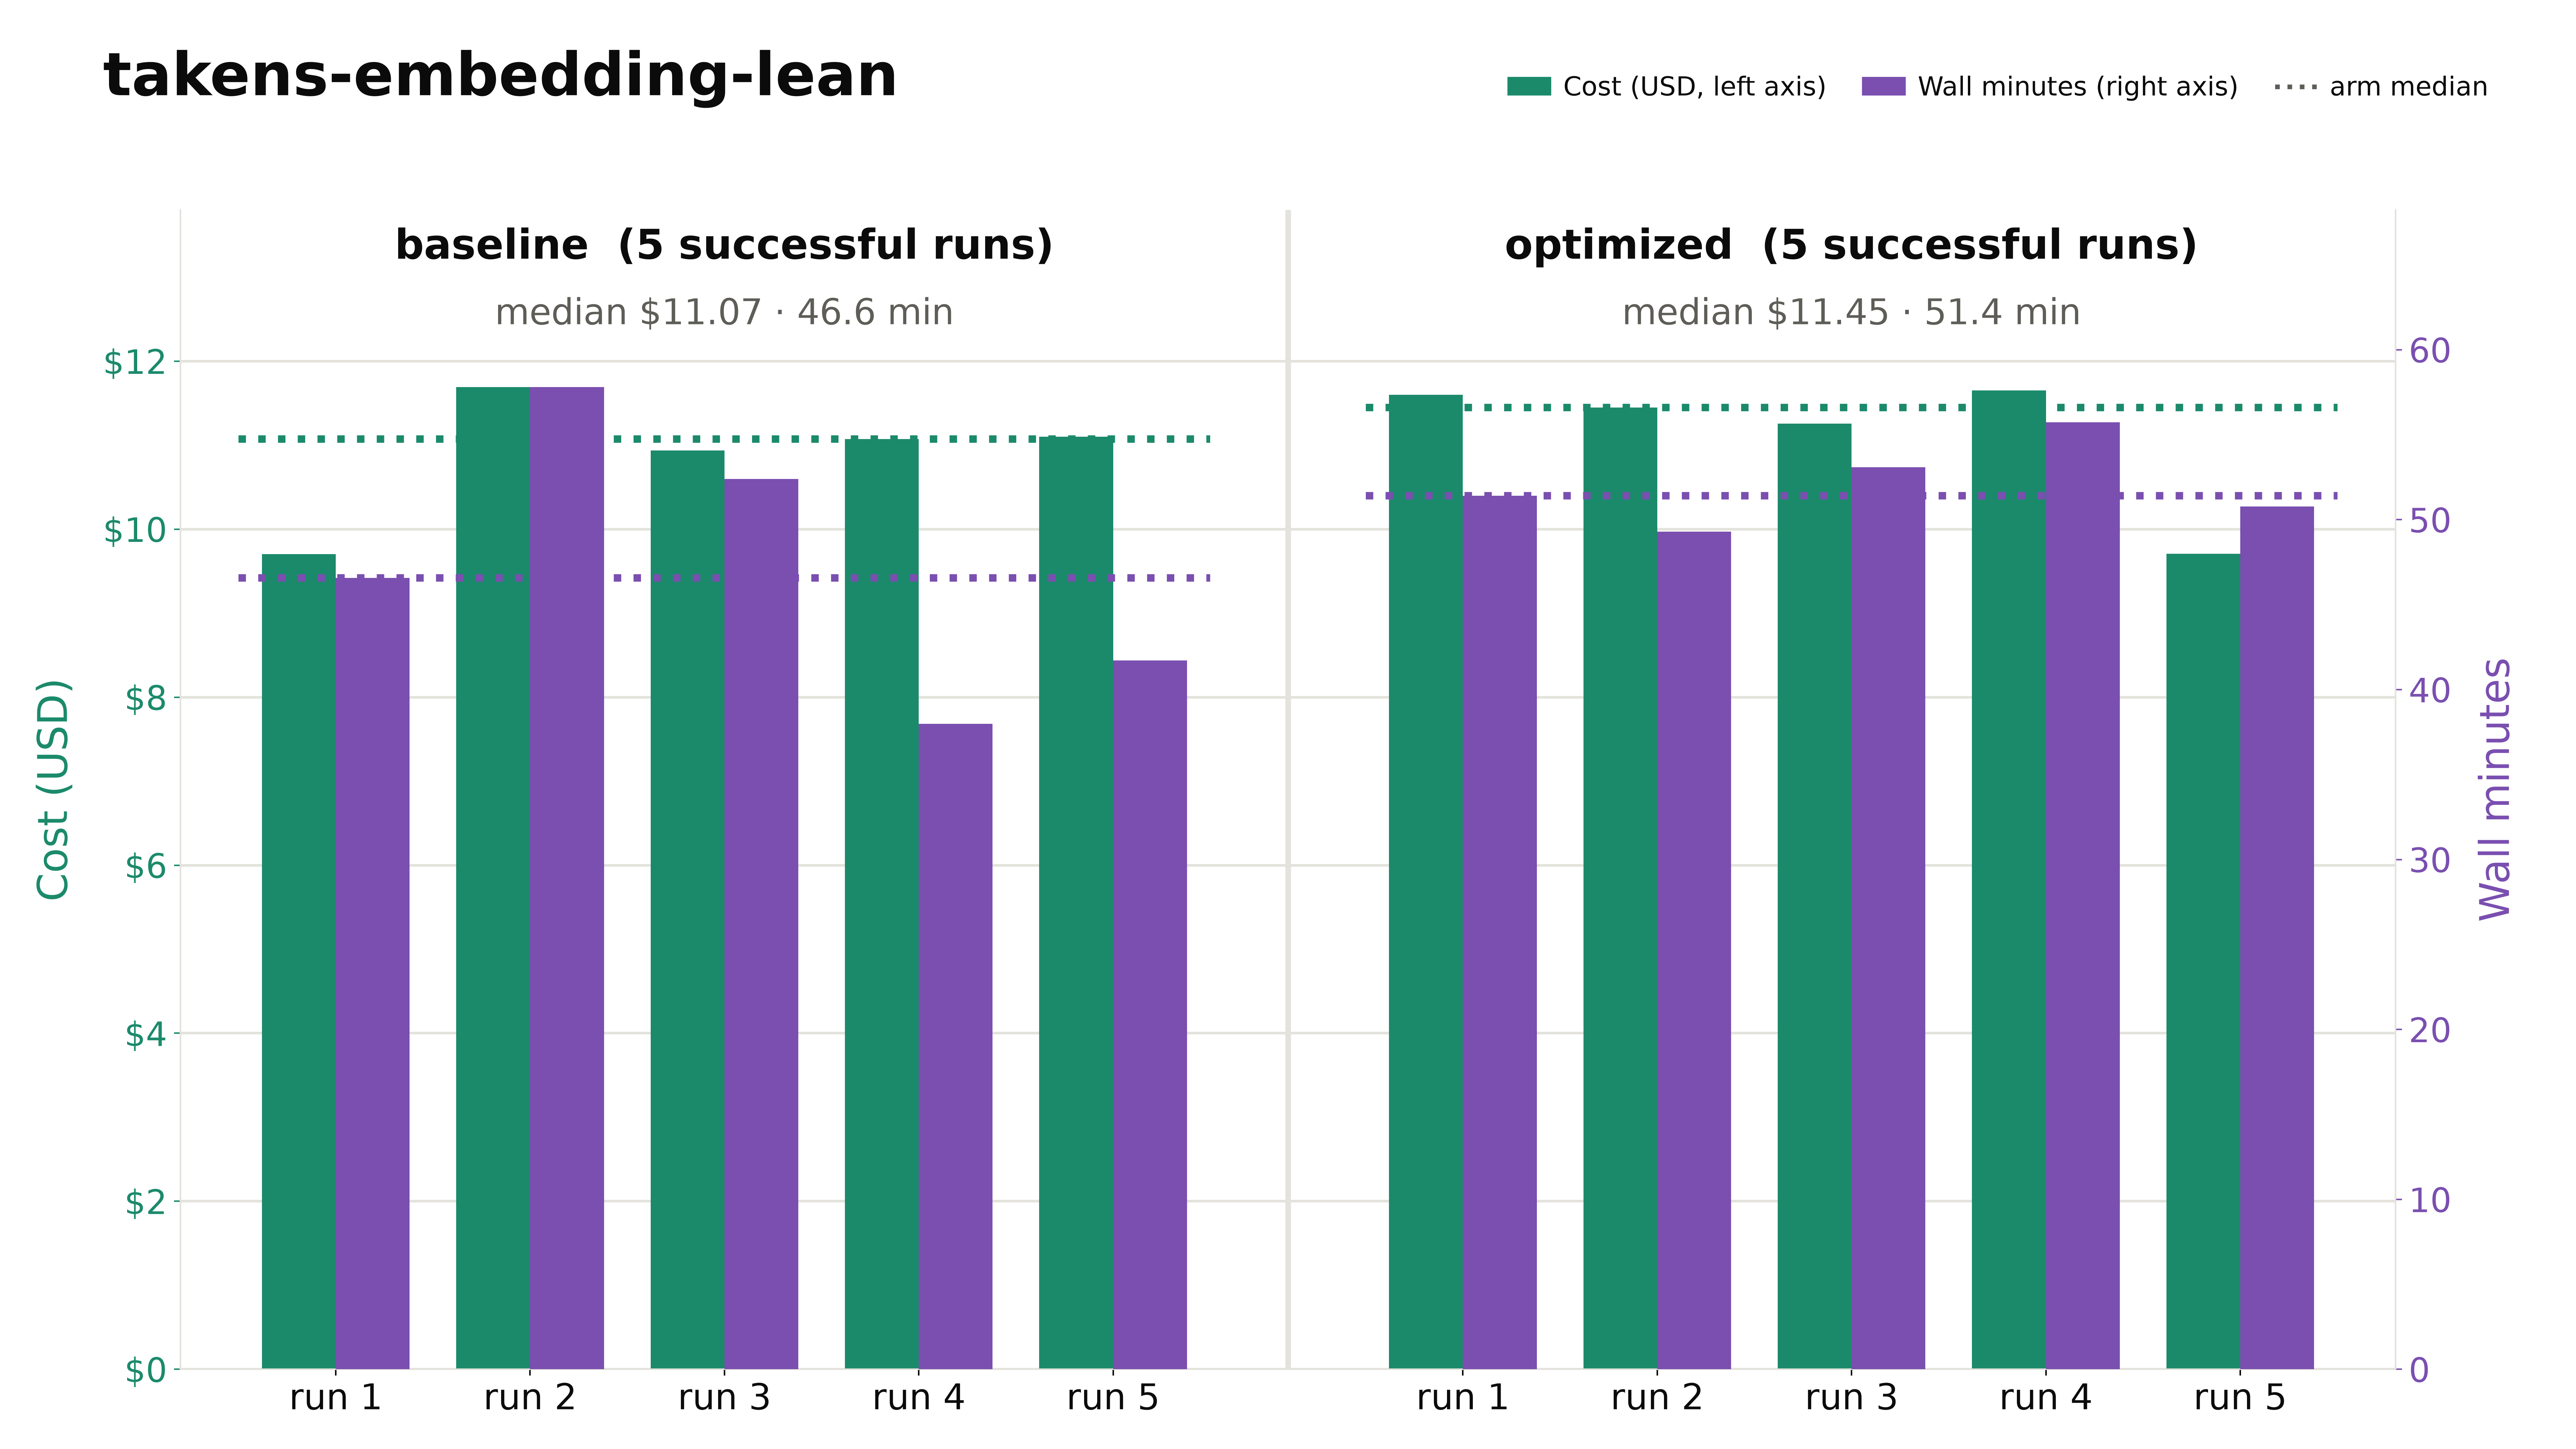
The agent is Claude Code 2.1.289 in headless mode, backed by claude-opus-5-5, the only model recorded in any run. It ran on a cloud VM: a KVM guest with 4 vCPUs (Intel Xeon @ 2.10 GHz), 15.7 GiB RAM and a 252 GiB disk, running Ubuntu 24.04.4 LTS and Docker 29.6.2. Every shell command ran inside the task’s own container, under the task’s resource caps (2-4 CPUs and 4-8 GiB; 10 GiB for takens-embedding-lean) and with no time limit. Each task ran five times in each of two arms. The baseline arm had no directives. The optimized arm had the six directives - inspired from the mapping between compiler optimizations and agentic execution shared in an earlier post - in CLAUDE.md and a 12,000-character cap on Bash output. We evaluate these changes as one combined intervention; this experiment does not isolate the contributions of individual directives or the output cap. Runs were independent rather than paired (run k of one arm has no special link to run k of the other), and the arm that ran first alternated between repeats: baseline first on odd repeats, optimized first on even ones.1 Each run was graded by the task’s own verifier.
Metrics
For each run, we monitored the following metrics:
| Metric | Definition |
|---|---|
| Cost | List-price cost reported by Claude Code. |
| Wall minutes | Wall-clock time of the agent session, from launch to exit; excludes container setup and grading. |
| Input tokens | All input tokens, cached or not. |
| Output tokens | All generated tokens, including reasoning. |
| Cache-hit rate | Share of input tokens read from the prompt cache. |
| Uncached input | Input not served from the prompt cache (fresh input plus cache writes). |
| Reasoning share | Reasoning tokens as a share of output tokens. |
| Turns | Model turns, summed over all wake-ups of the session. |
Analysis Methodology
We compare the baseline and optimized configurations using successful runs only. For each task and metric, we estimate the effect of the combined intervention with the two-sample Hodges–Lehmann (HL) shift on the log scale, i.e., the median of all pairwise log-ratios between optimized and baseline runs, reported as a percentage change.2 For the two rates, cache-hit rate and reasoning share, we report differences in percentage points. Changes quoted for individual tasks are these HL estimates; the plots show arm medians, a different estimator.
To summarize across tasks, we average the per-task log-shifts. This is the geometric mean3 of the per-task ratios [1], so every task carries equal weight (see Appendix A). We flag a run as anomalous when its robust z-score, based on the median absolute deviation (MAD), exceeds 2.5 in magnitude within its task and arm [2]. Flagged runs are reported but never removed.4
To find what drives time and cost, we fit run-level Gamma generalized linear models (GLMs) with a log link and task fixed effects [3]: log E[y] = αtask + β·log x. The coefficient β is a within-task elasticity, the percentage change in y per 1% change in x. The two rates enter unlogged, in percentage points (0–100): log E[y] = αtask + β·r, so each one-point increase changes y by the same 100 × (exp(β) − 1)%. Fit is reported as the share of within-task deviance that the predictor explains, D².5
Results
The table below summarizes the combined intervention across the ten tasks: relative changes are geometric means of the per-task HL ratios, and changes in the two rates are in percentage points.
| Metric | % change |
|---|---|
| Cost | −20.9% |
| Wall minutes | −24.0% |
| Input tokens | −25.5% |
| Output tokens | −20.1% |
| Cache-hit rate | −0.3 pts |
| Uncached input | −19.8% |
| Reasoning share | −1.3 pts |
| Turns | −15.7% |
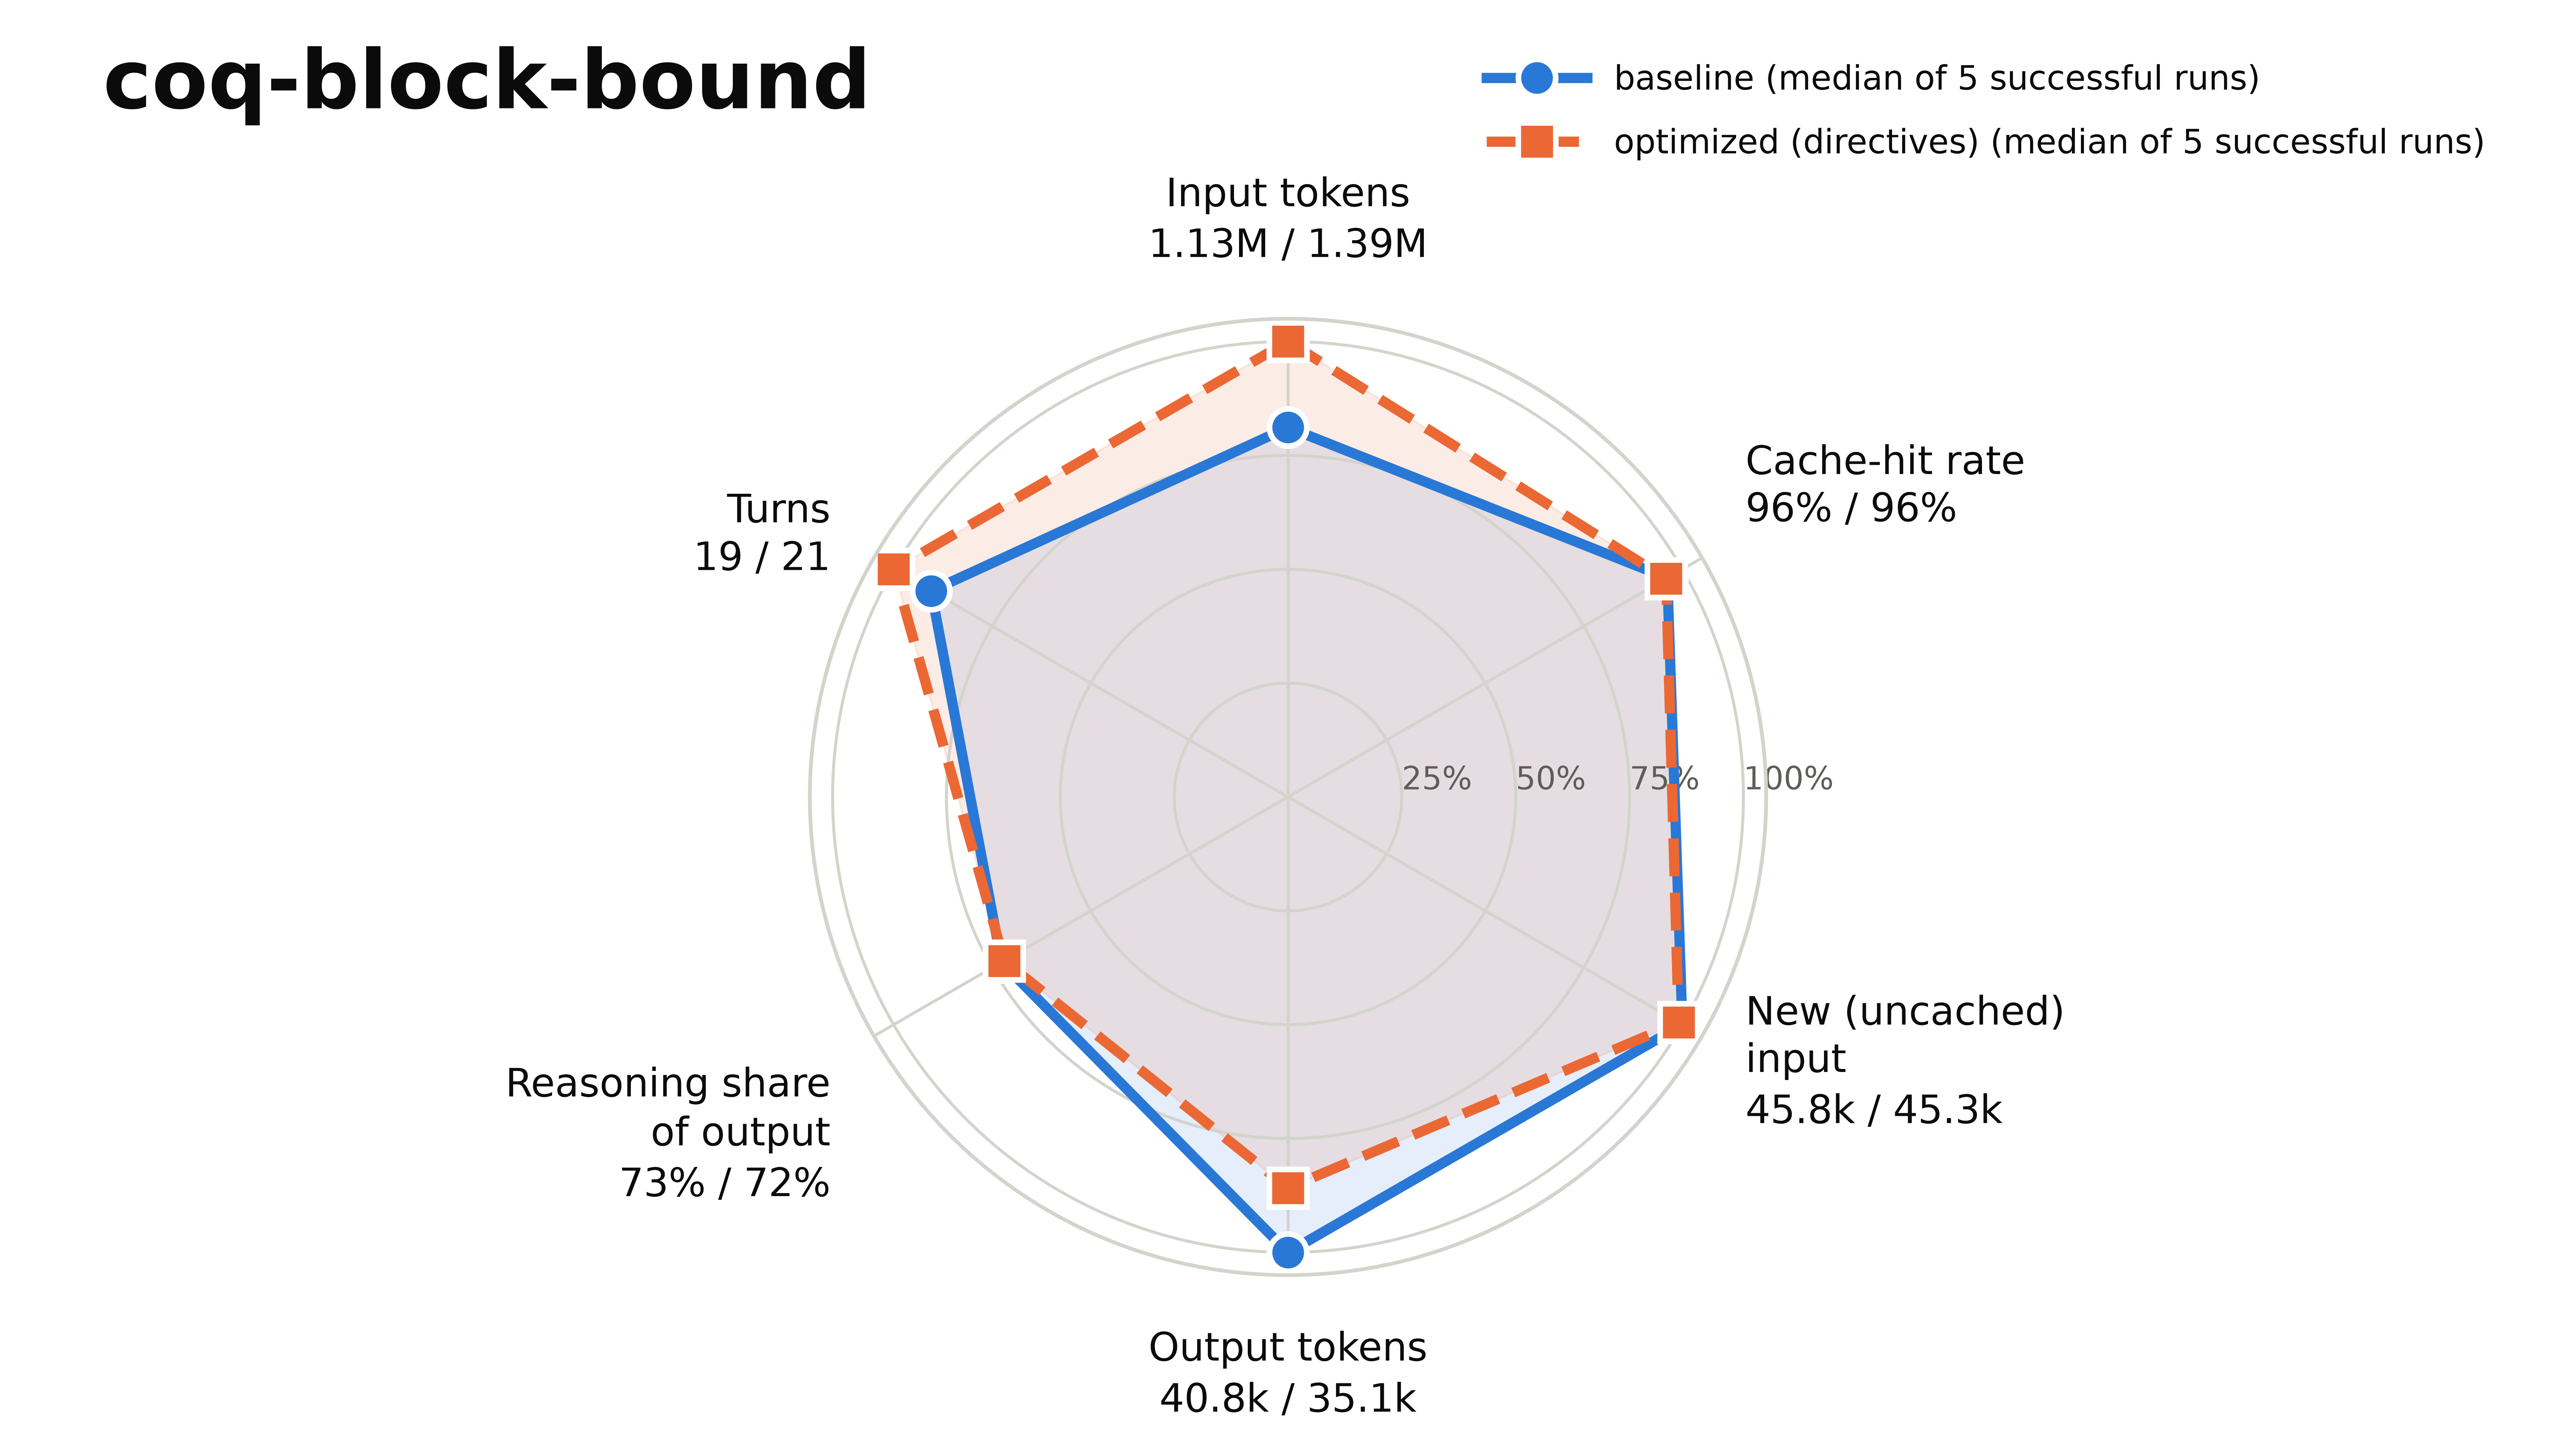
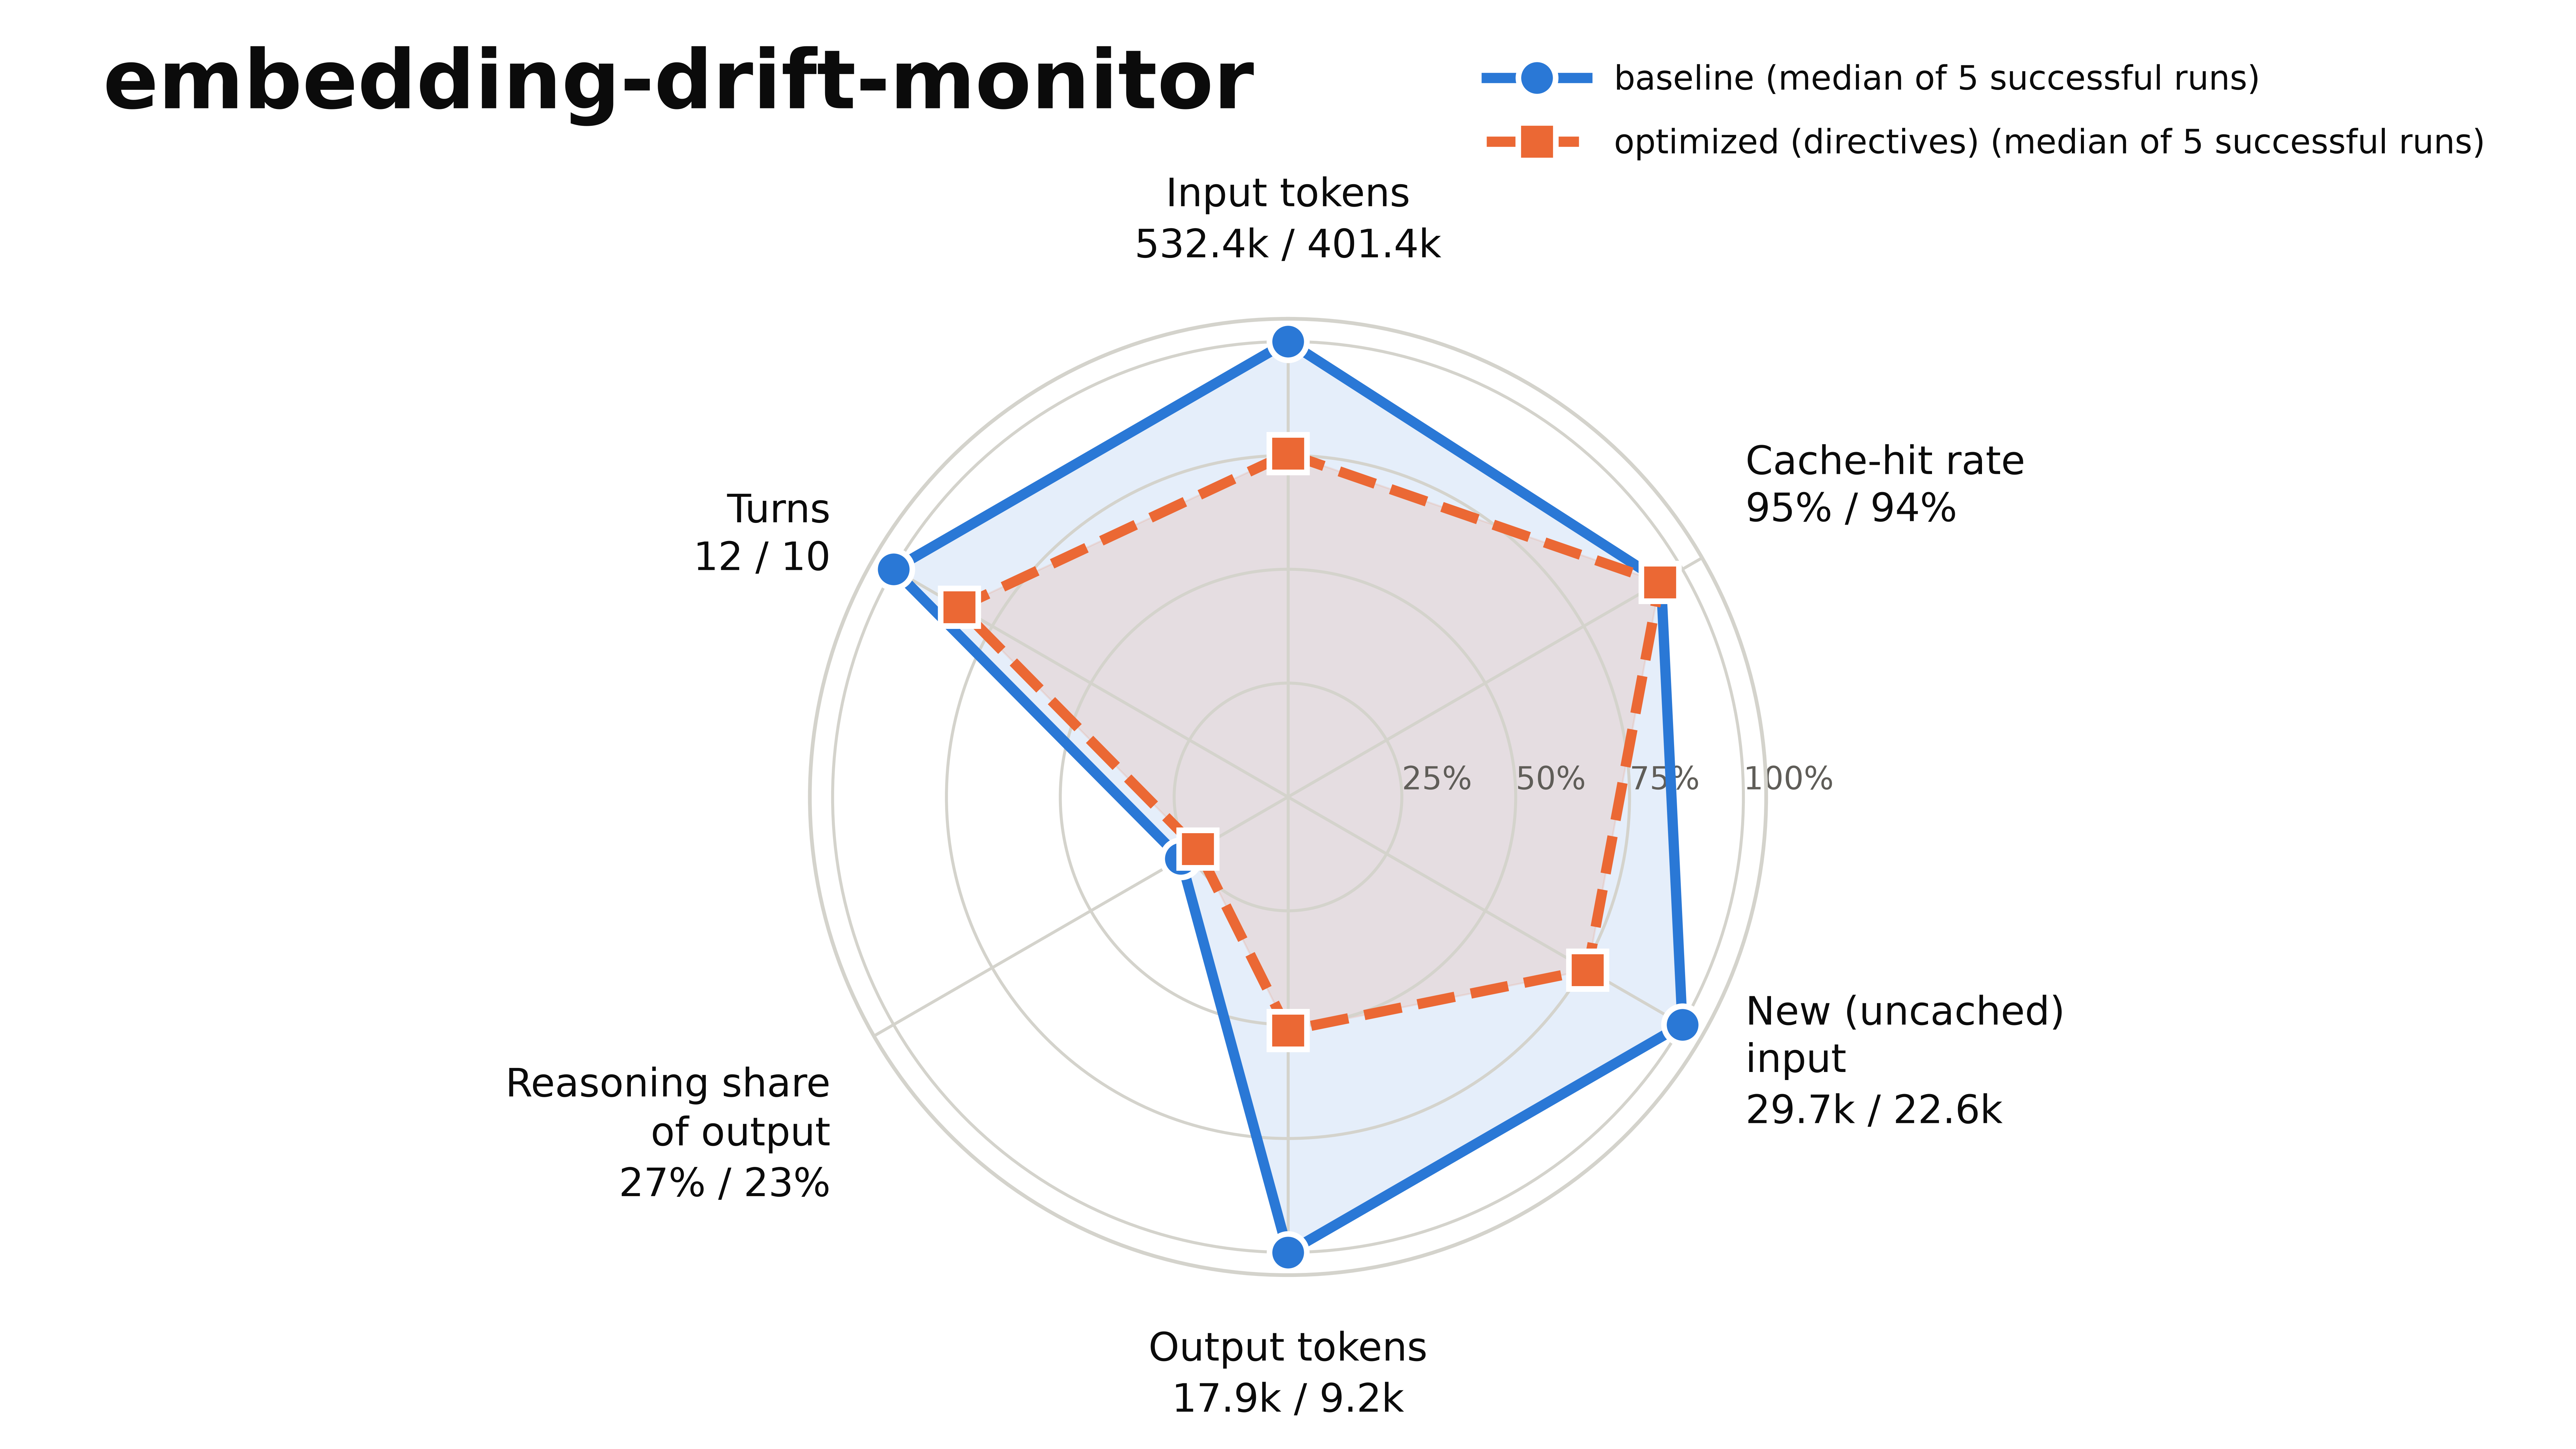
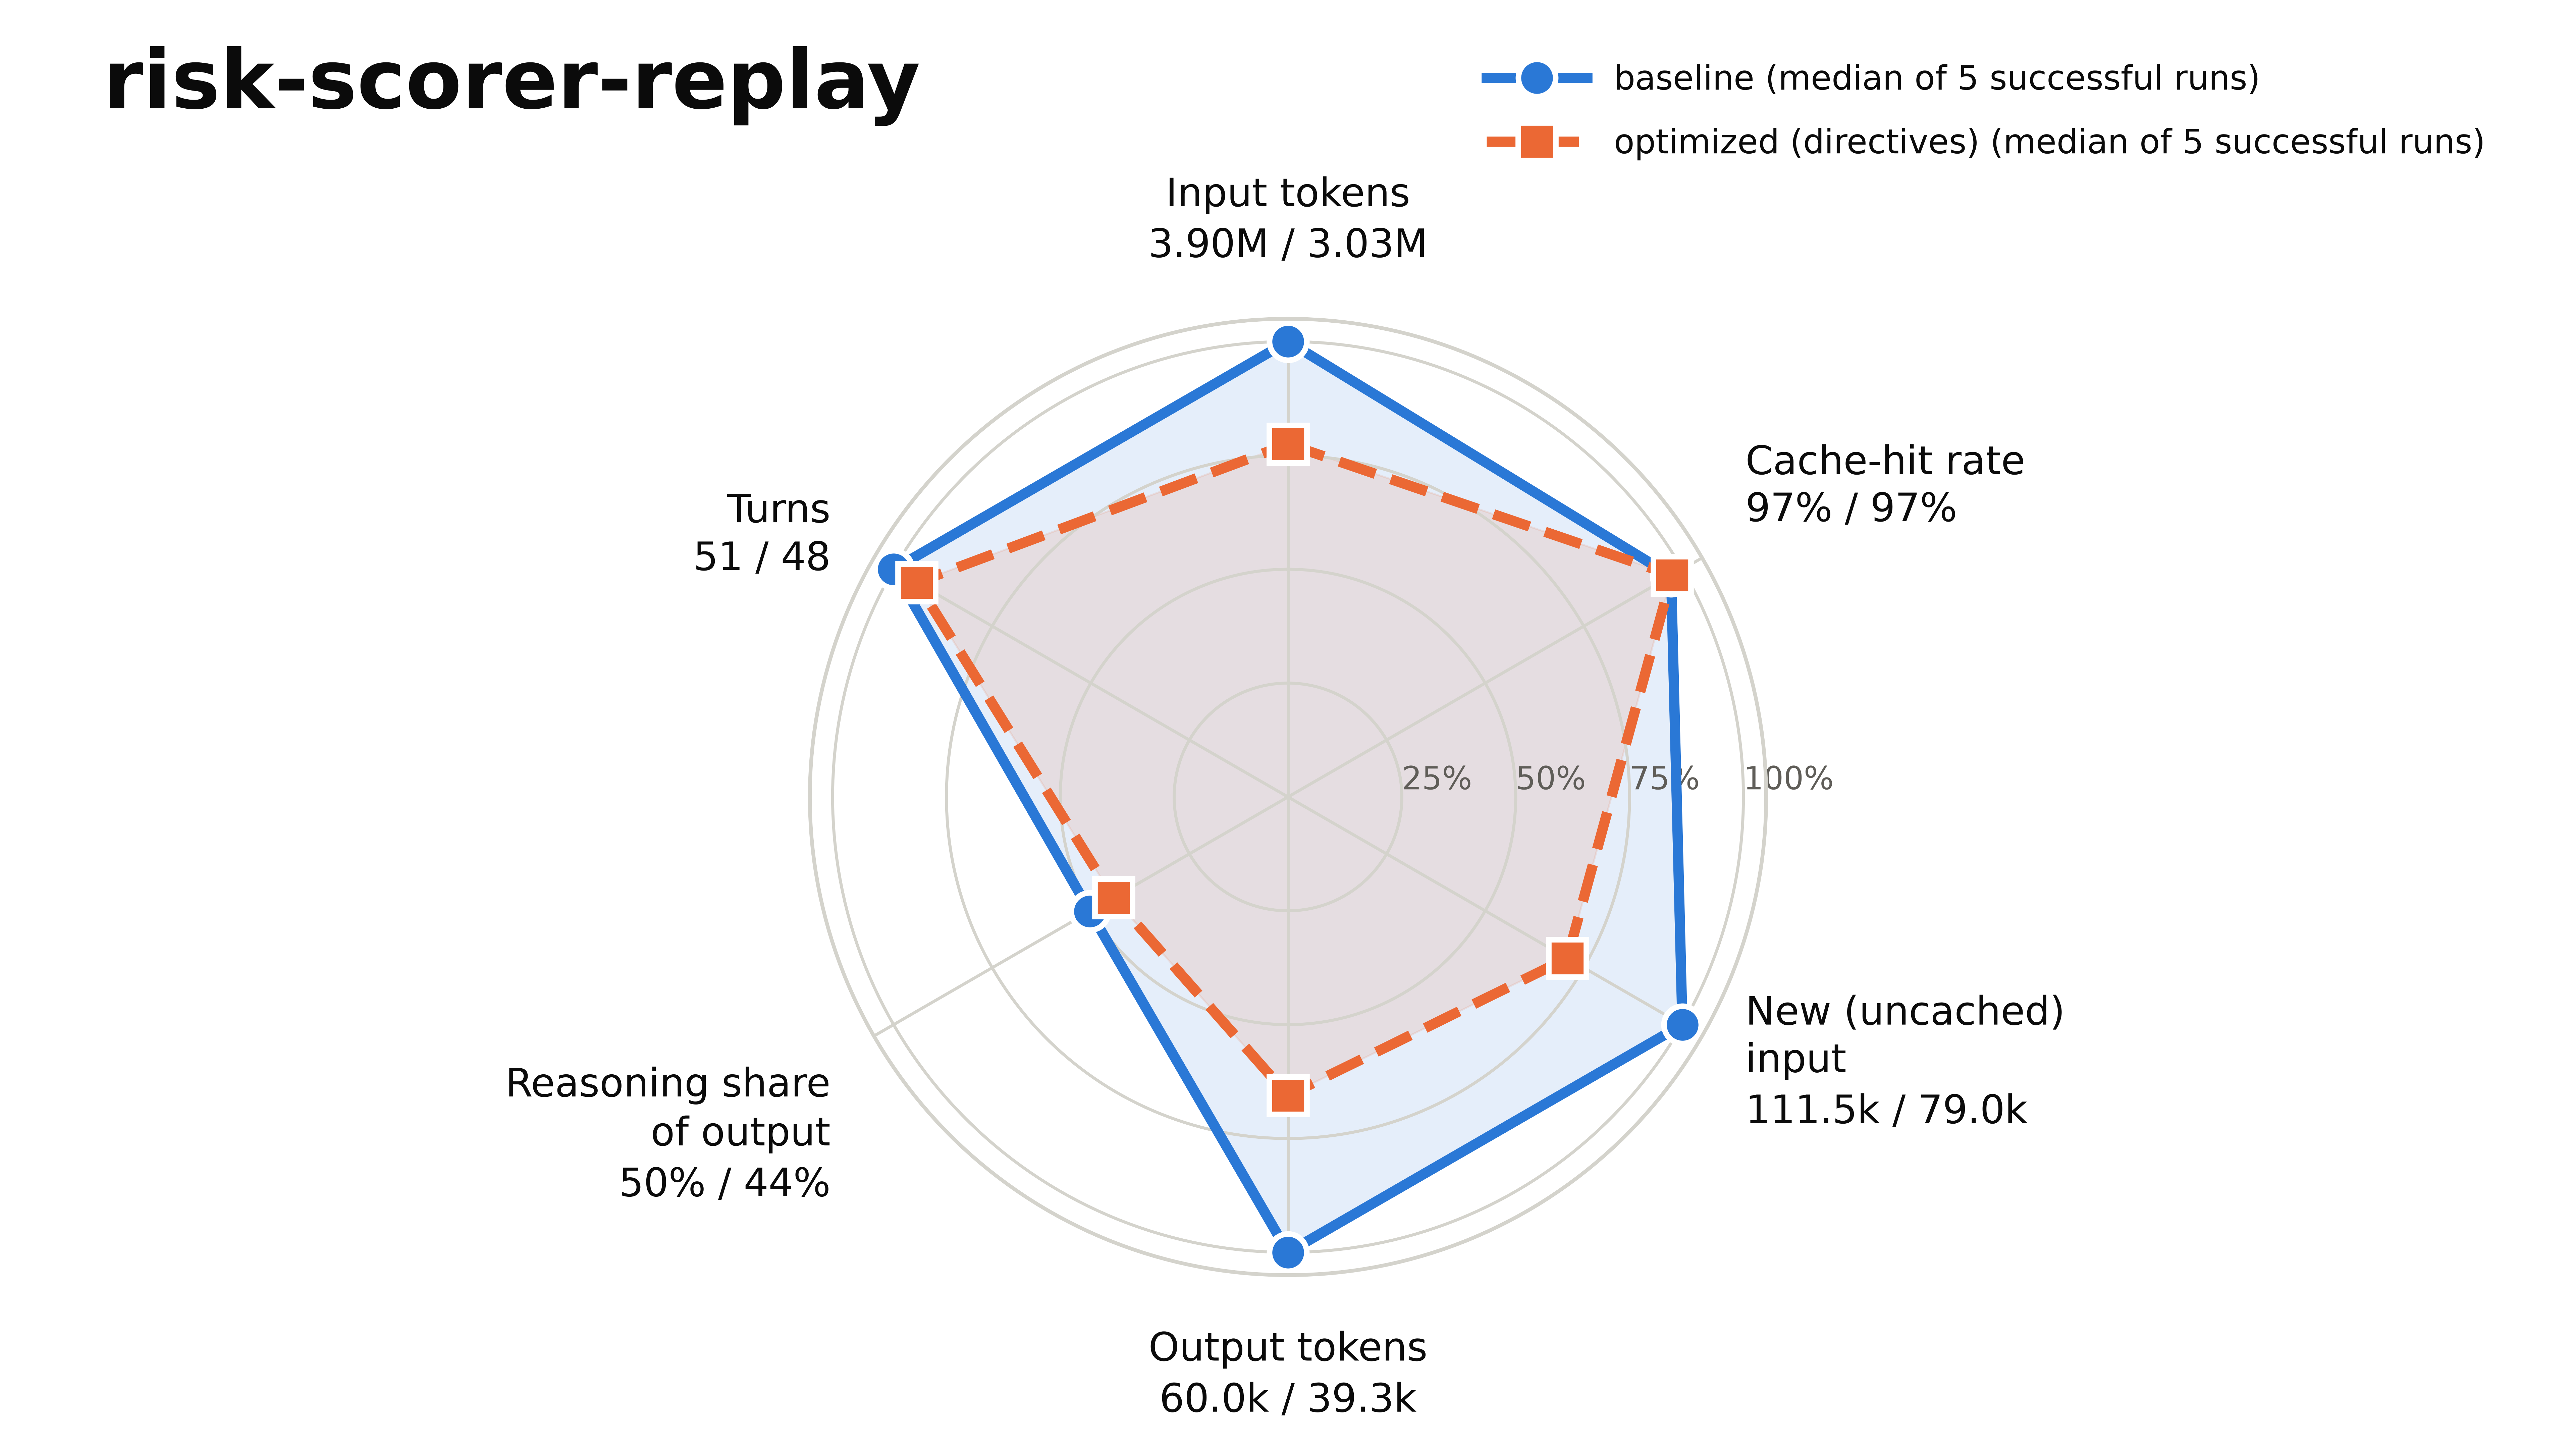
Among successful runs, the combined intervention was associated with reductions of 20.9% in cost and 24.0% in wall time, the two topline metrics (in bold). The under-the-hood metrics overlap and fell by varying amounts, input and output tokens the most. Cache-hit rate and reasoning share barely moved, so the savings came from the agent doing less work, not from better caching or less reasoning per token. The Kiviat plots below compare the two arms on each task. In each plot,
- Each vertex is the per-metric median over that arm’s successful runs.
- The token and turn axes are scaled to the larger of the two arms, so the larger arm sits at 100%.
- Cache-hit rate and reasoning share are plotted as they are, on a 0-100% scale.
- The numbers under each axis label are the baseline / optimized medians.
- These plots show arm medians for descriptive comparison. A ratio of two medians is a different estimator from the HL effect, the median of all pairwise ratios, and can differ from it substantially, even in sign.
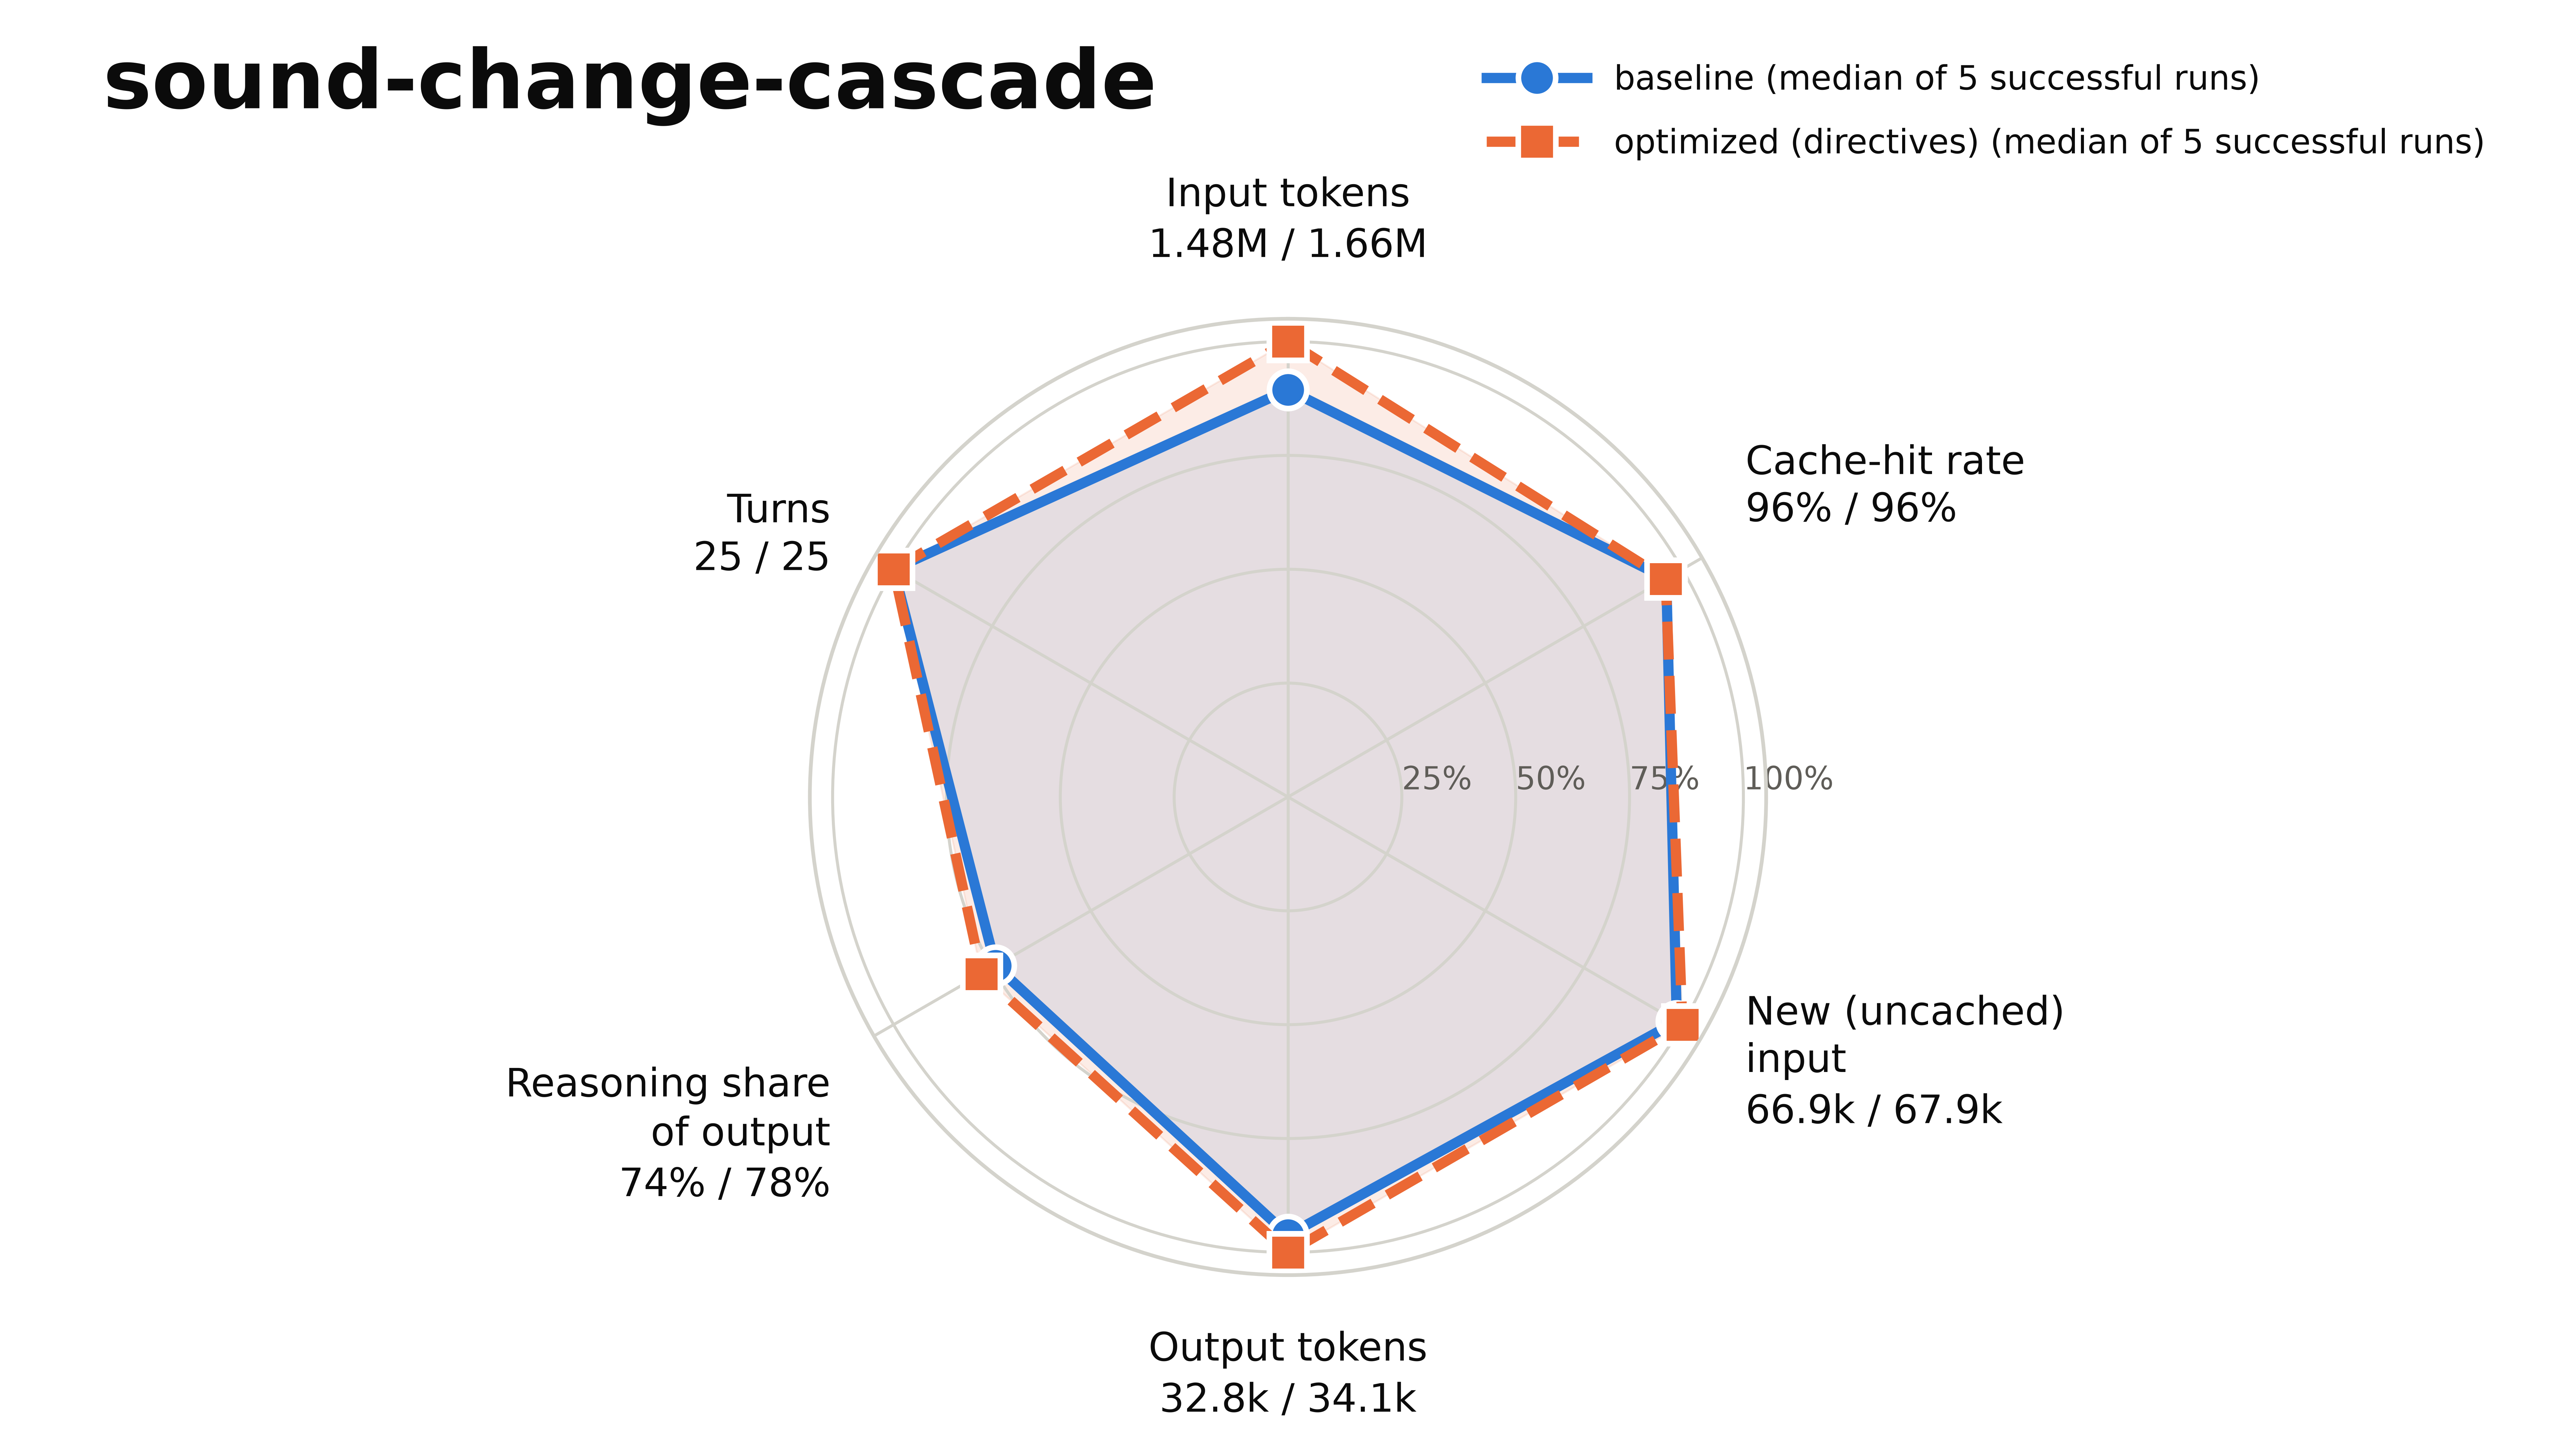
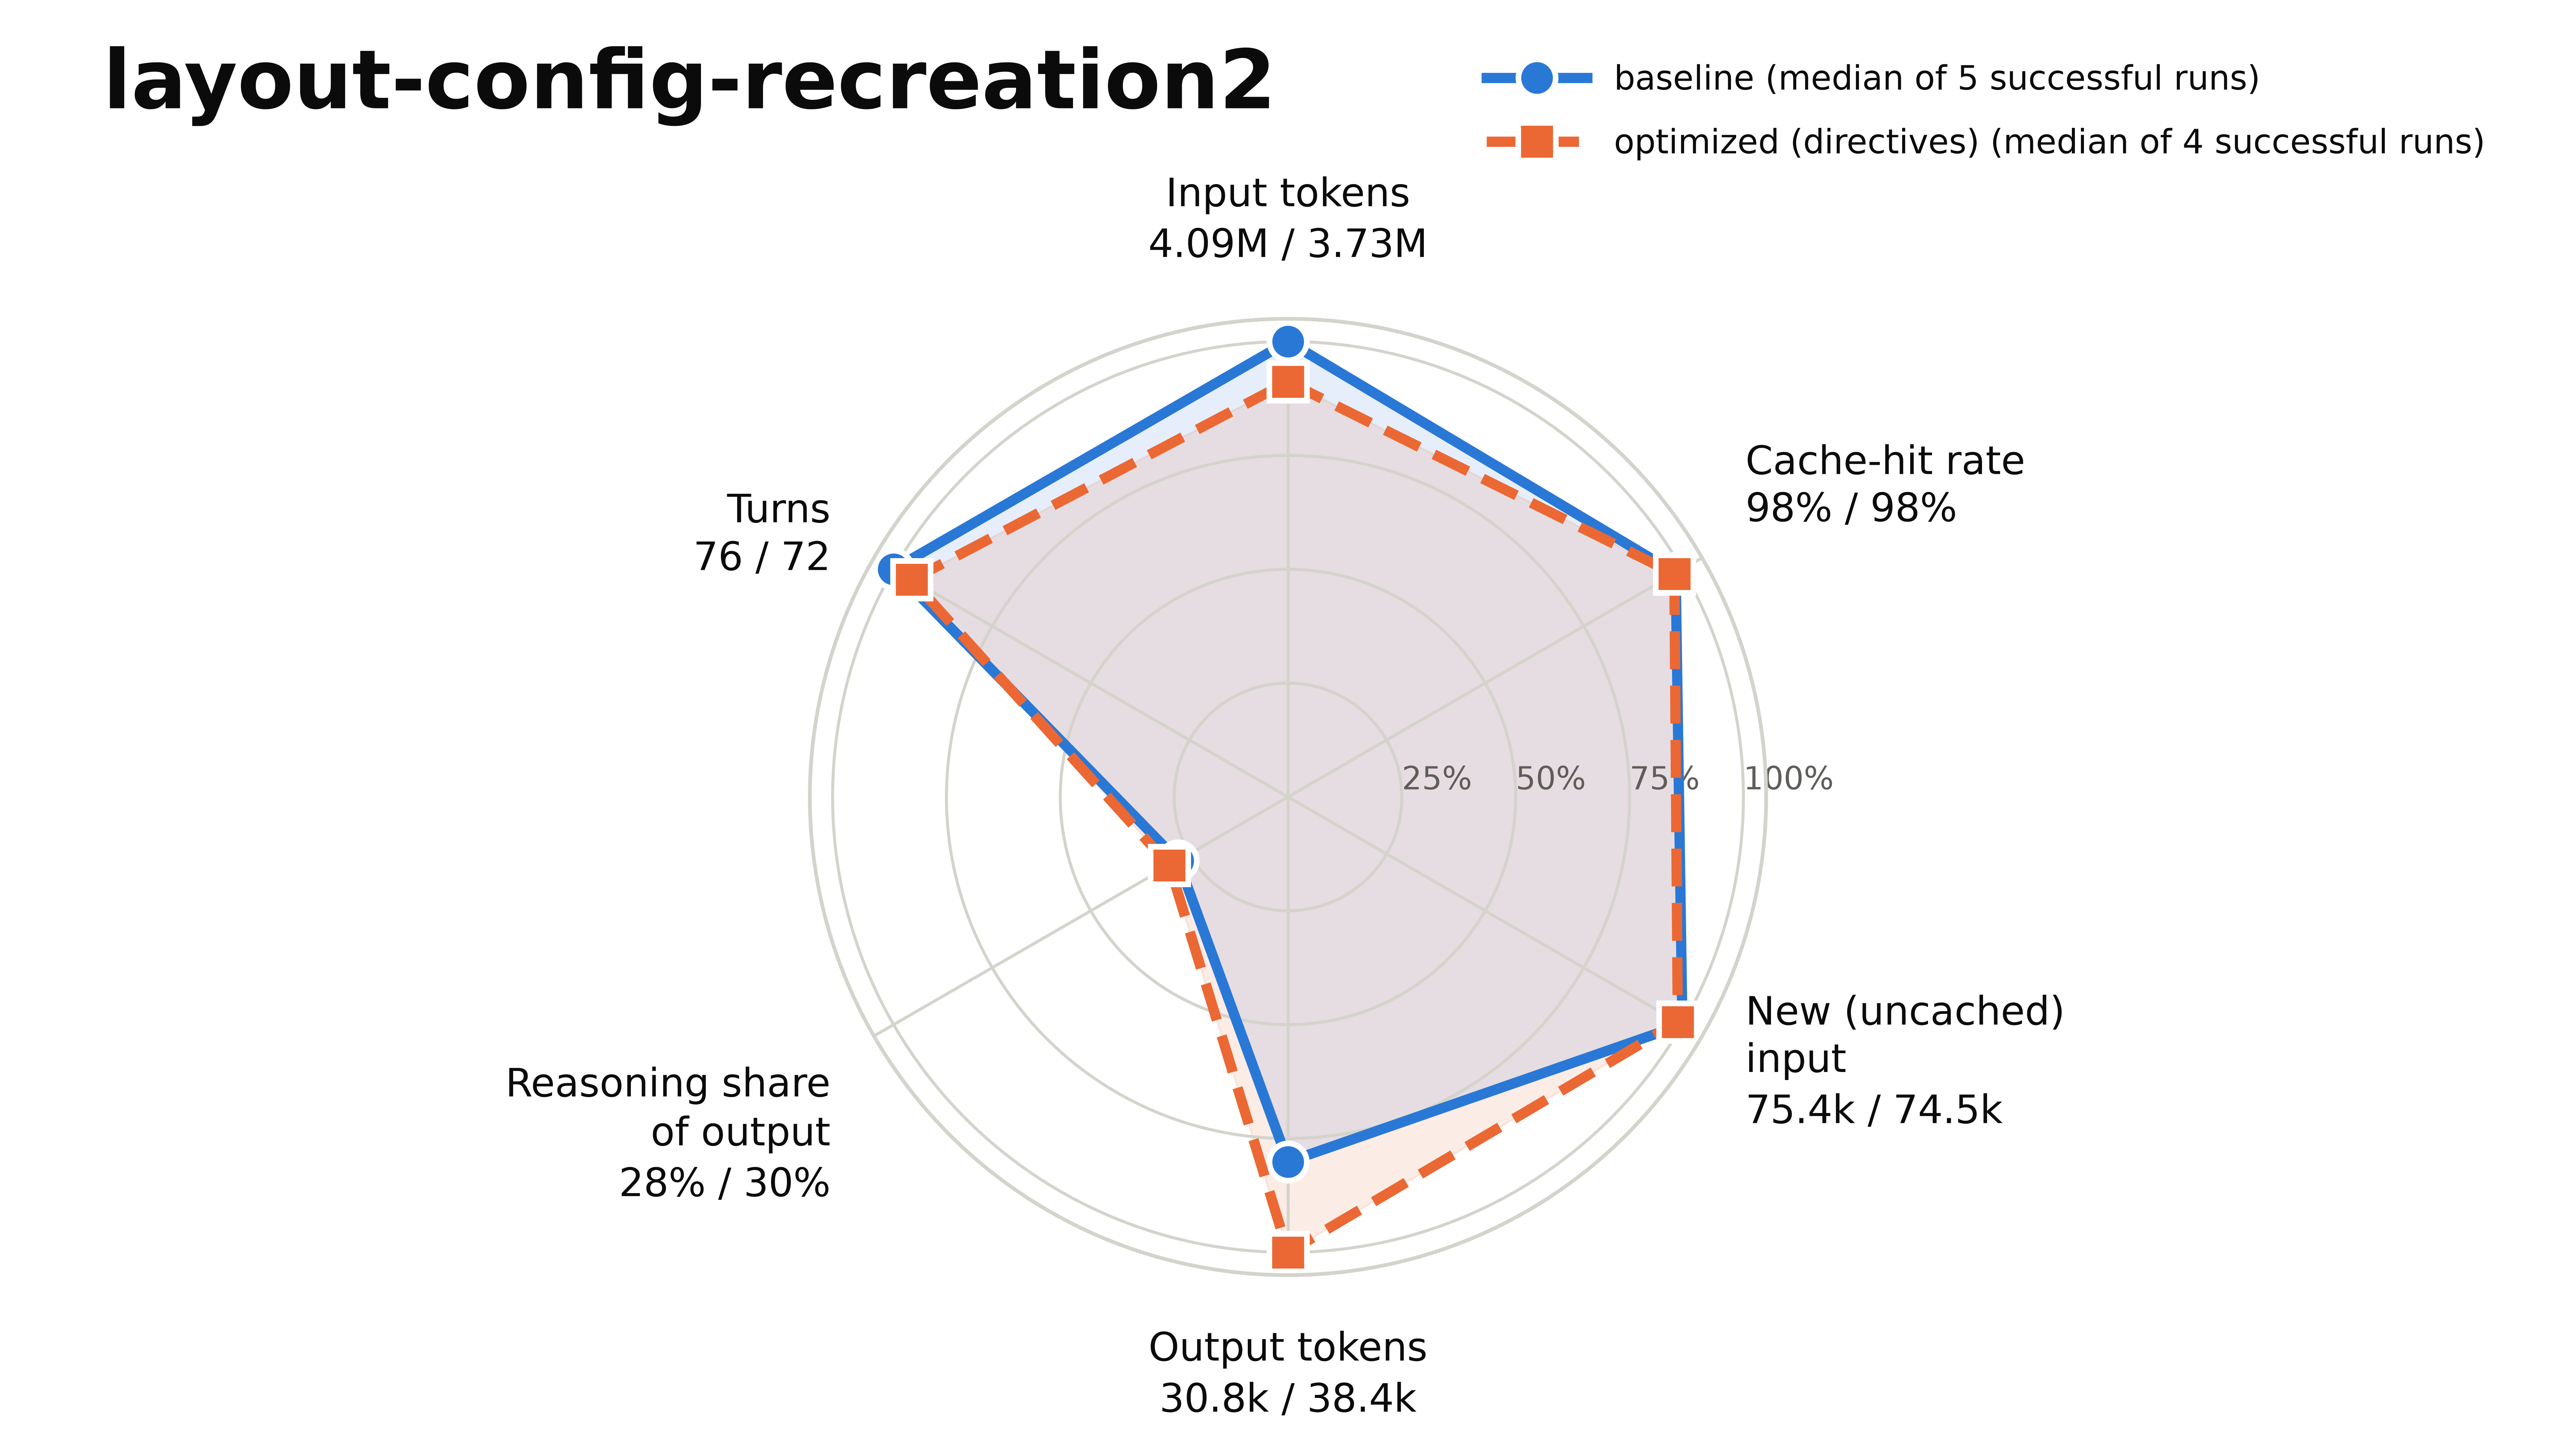
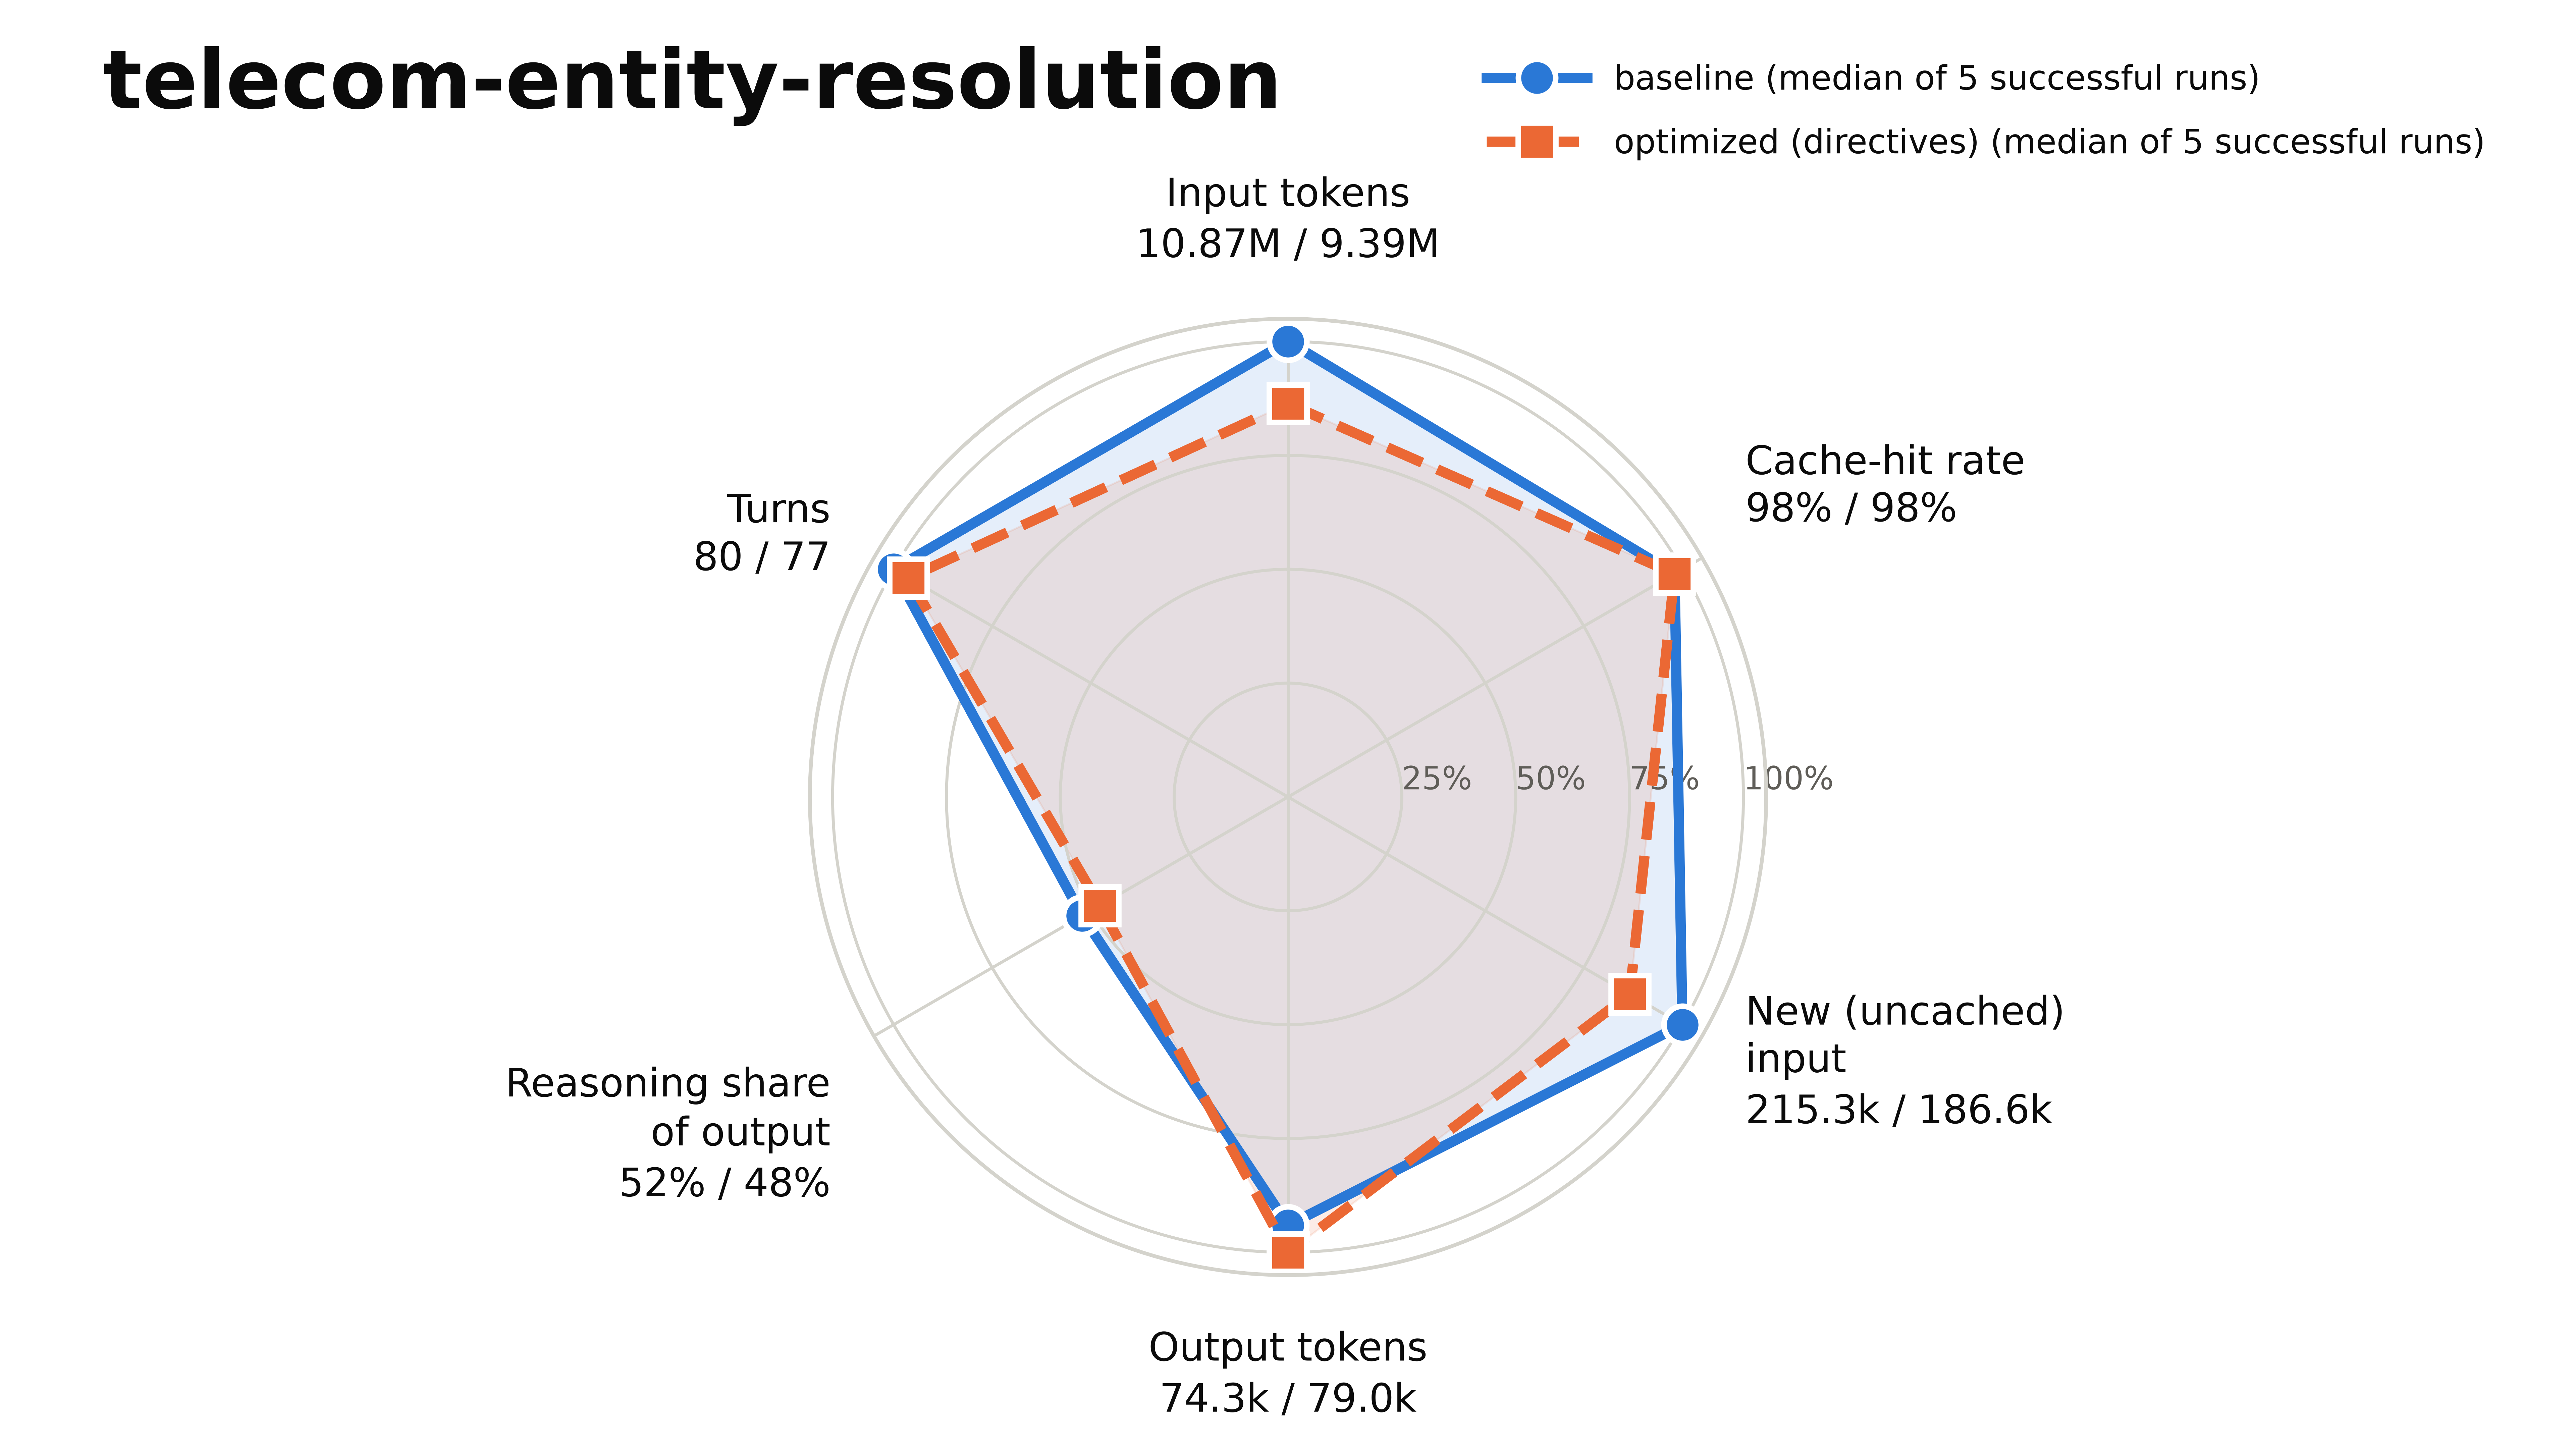
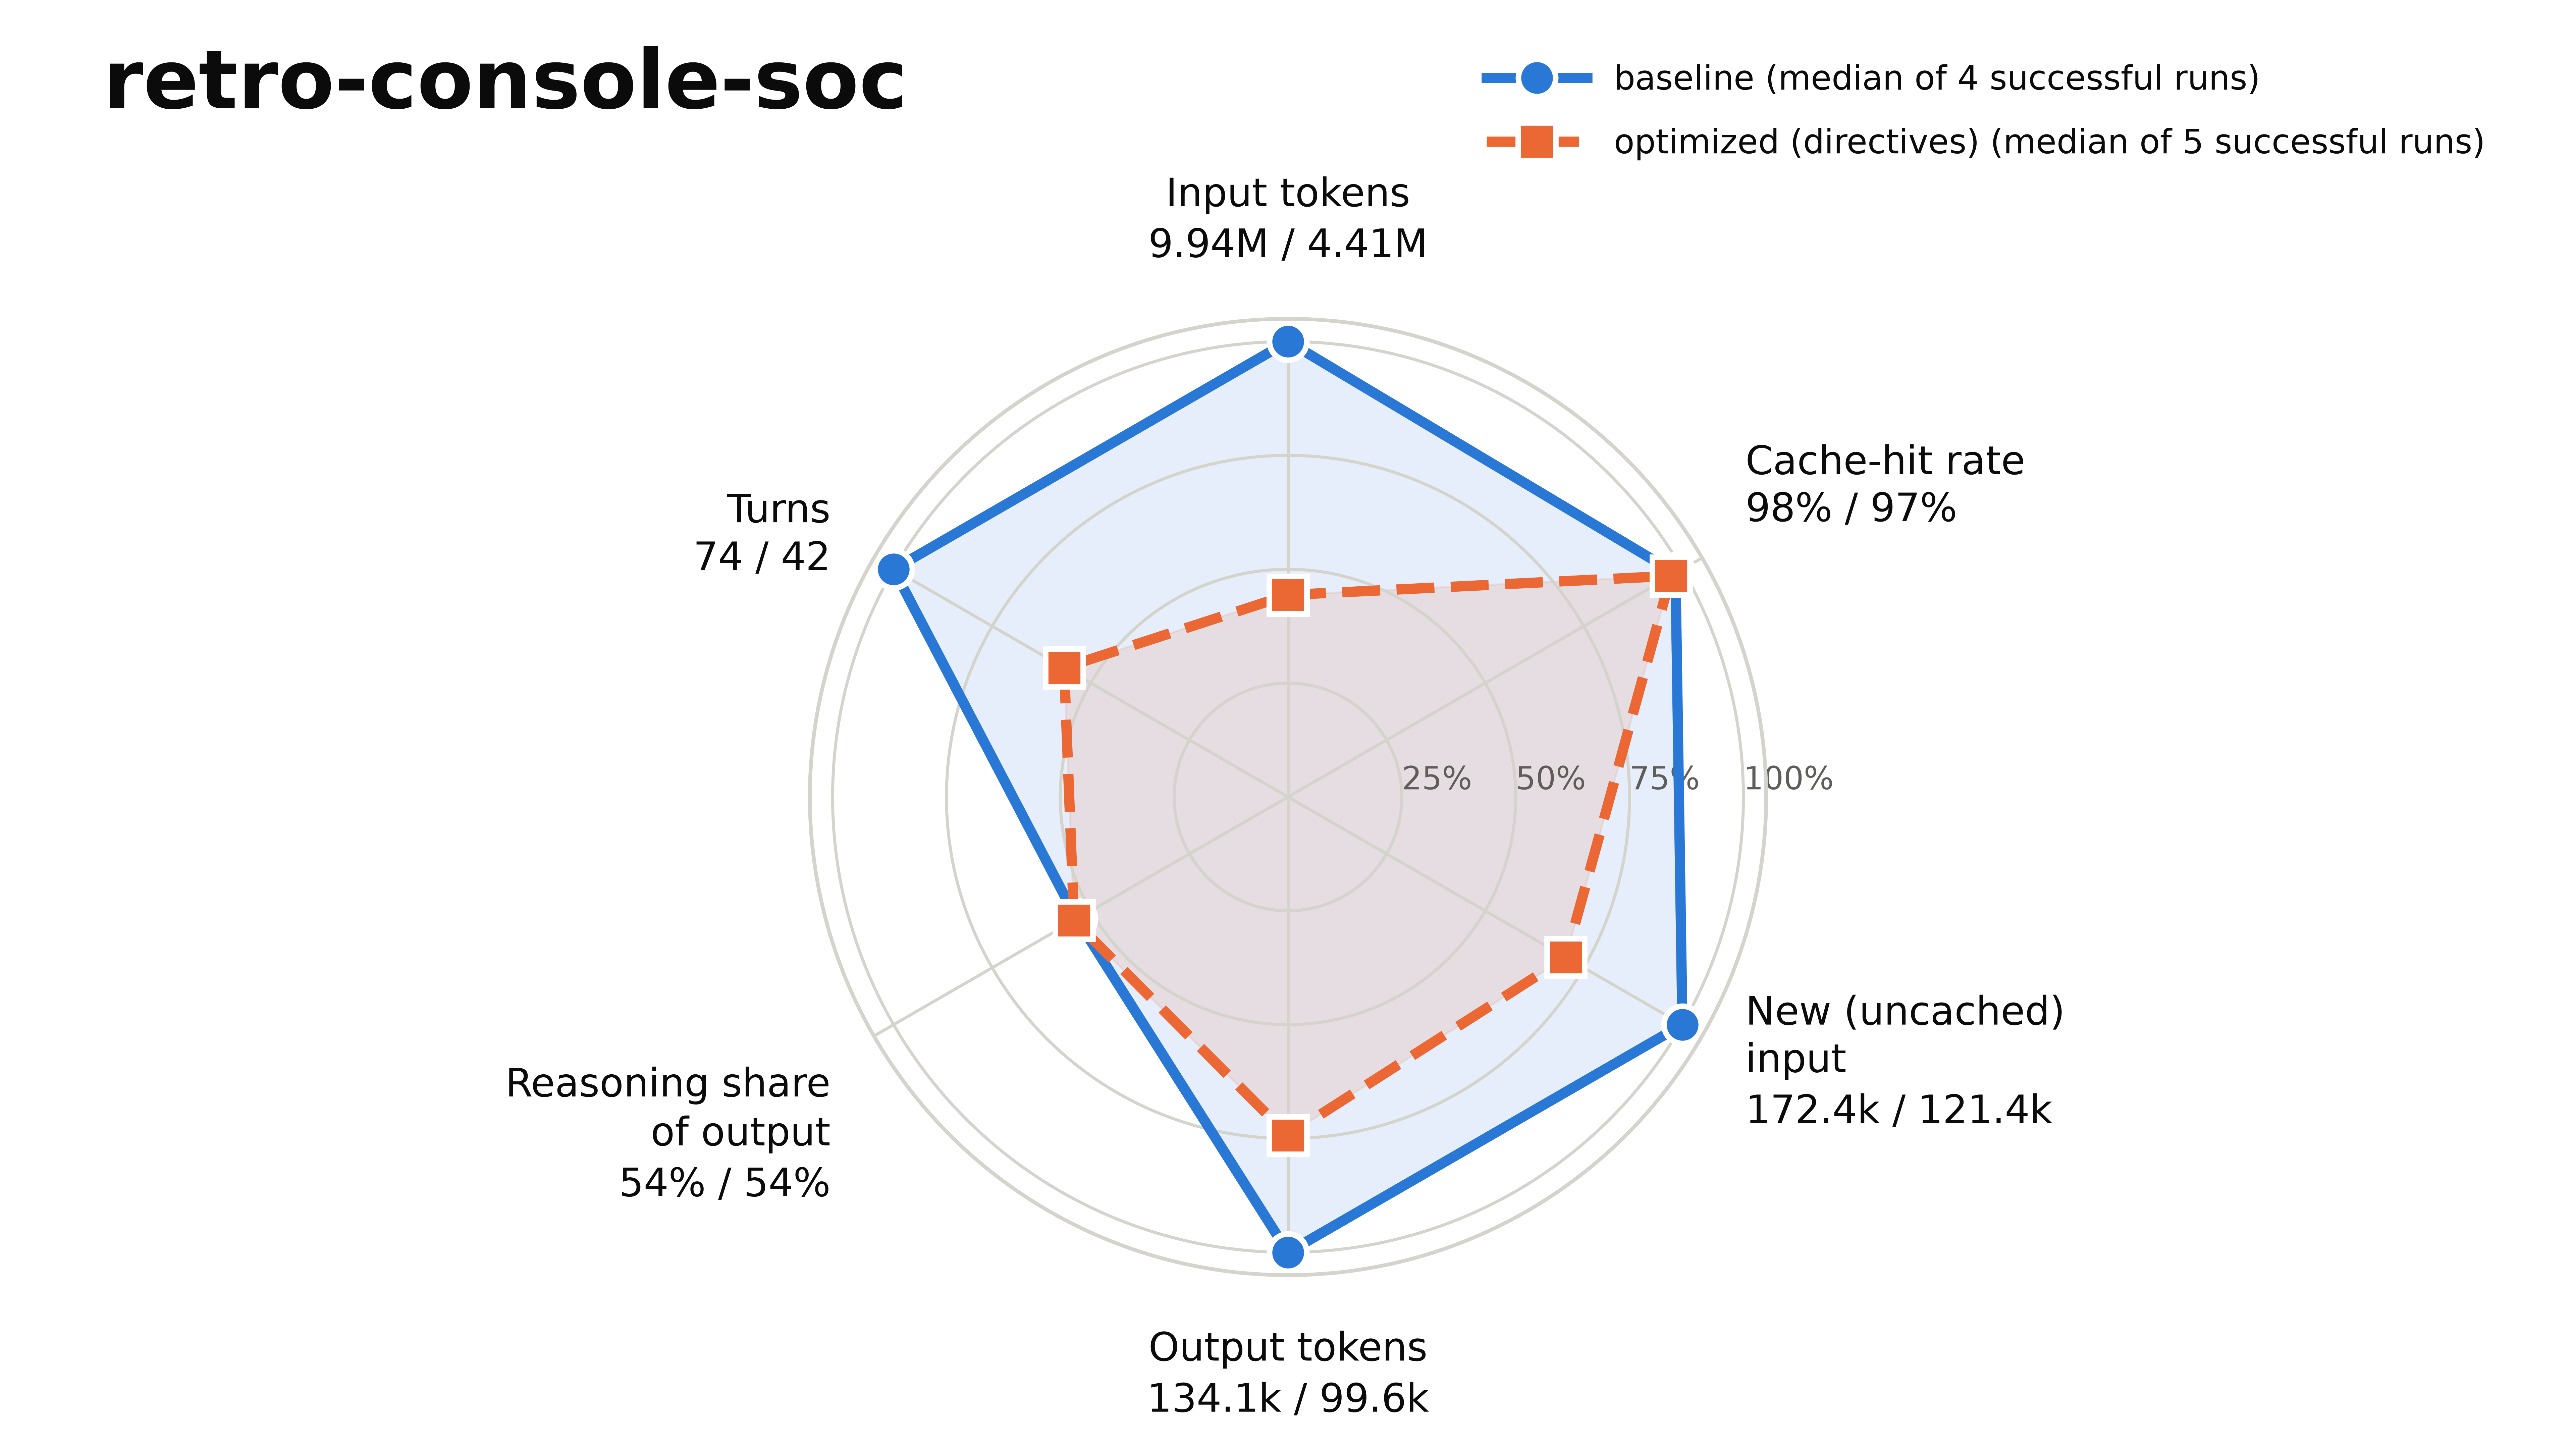
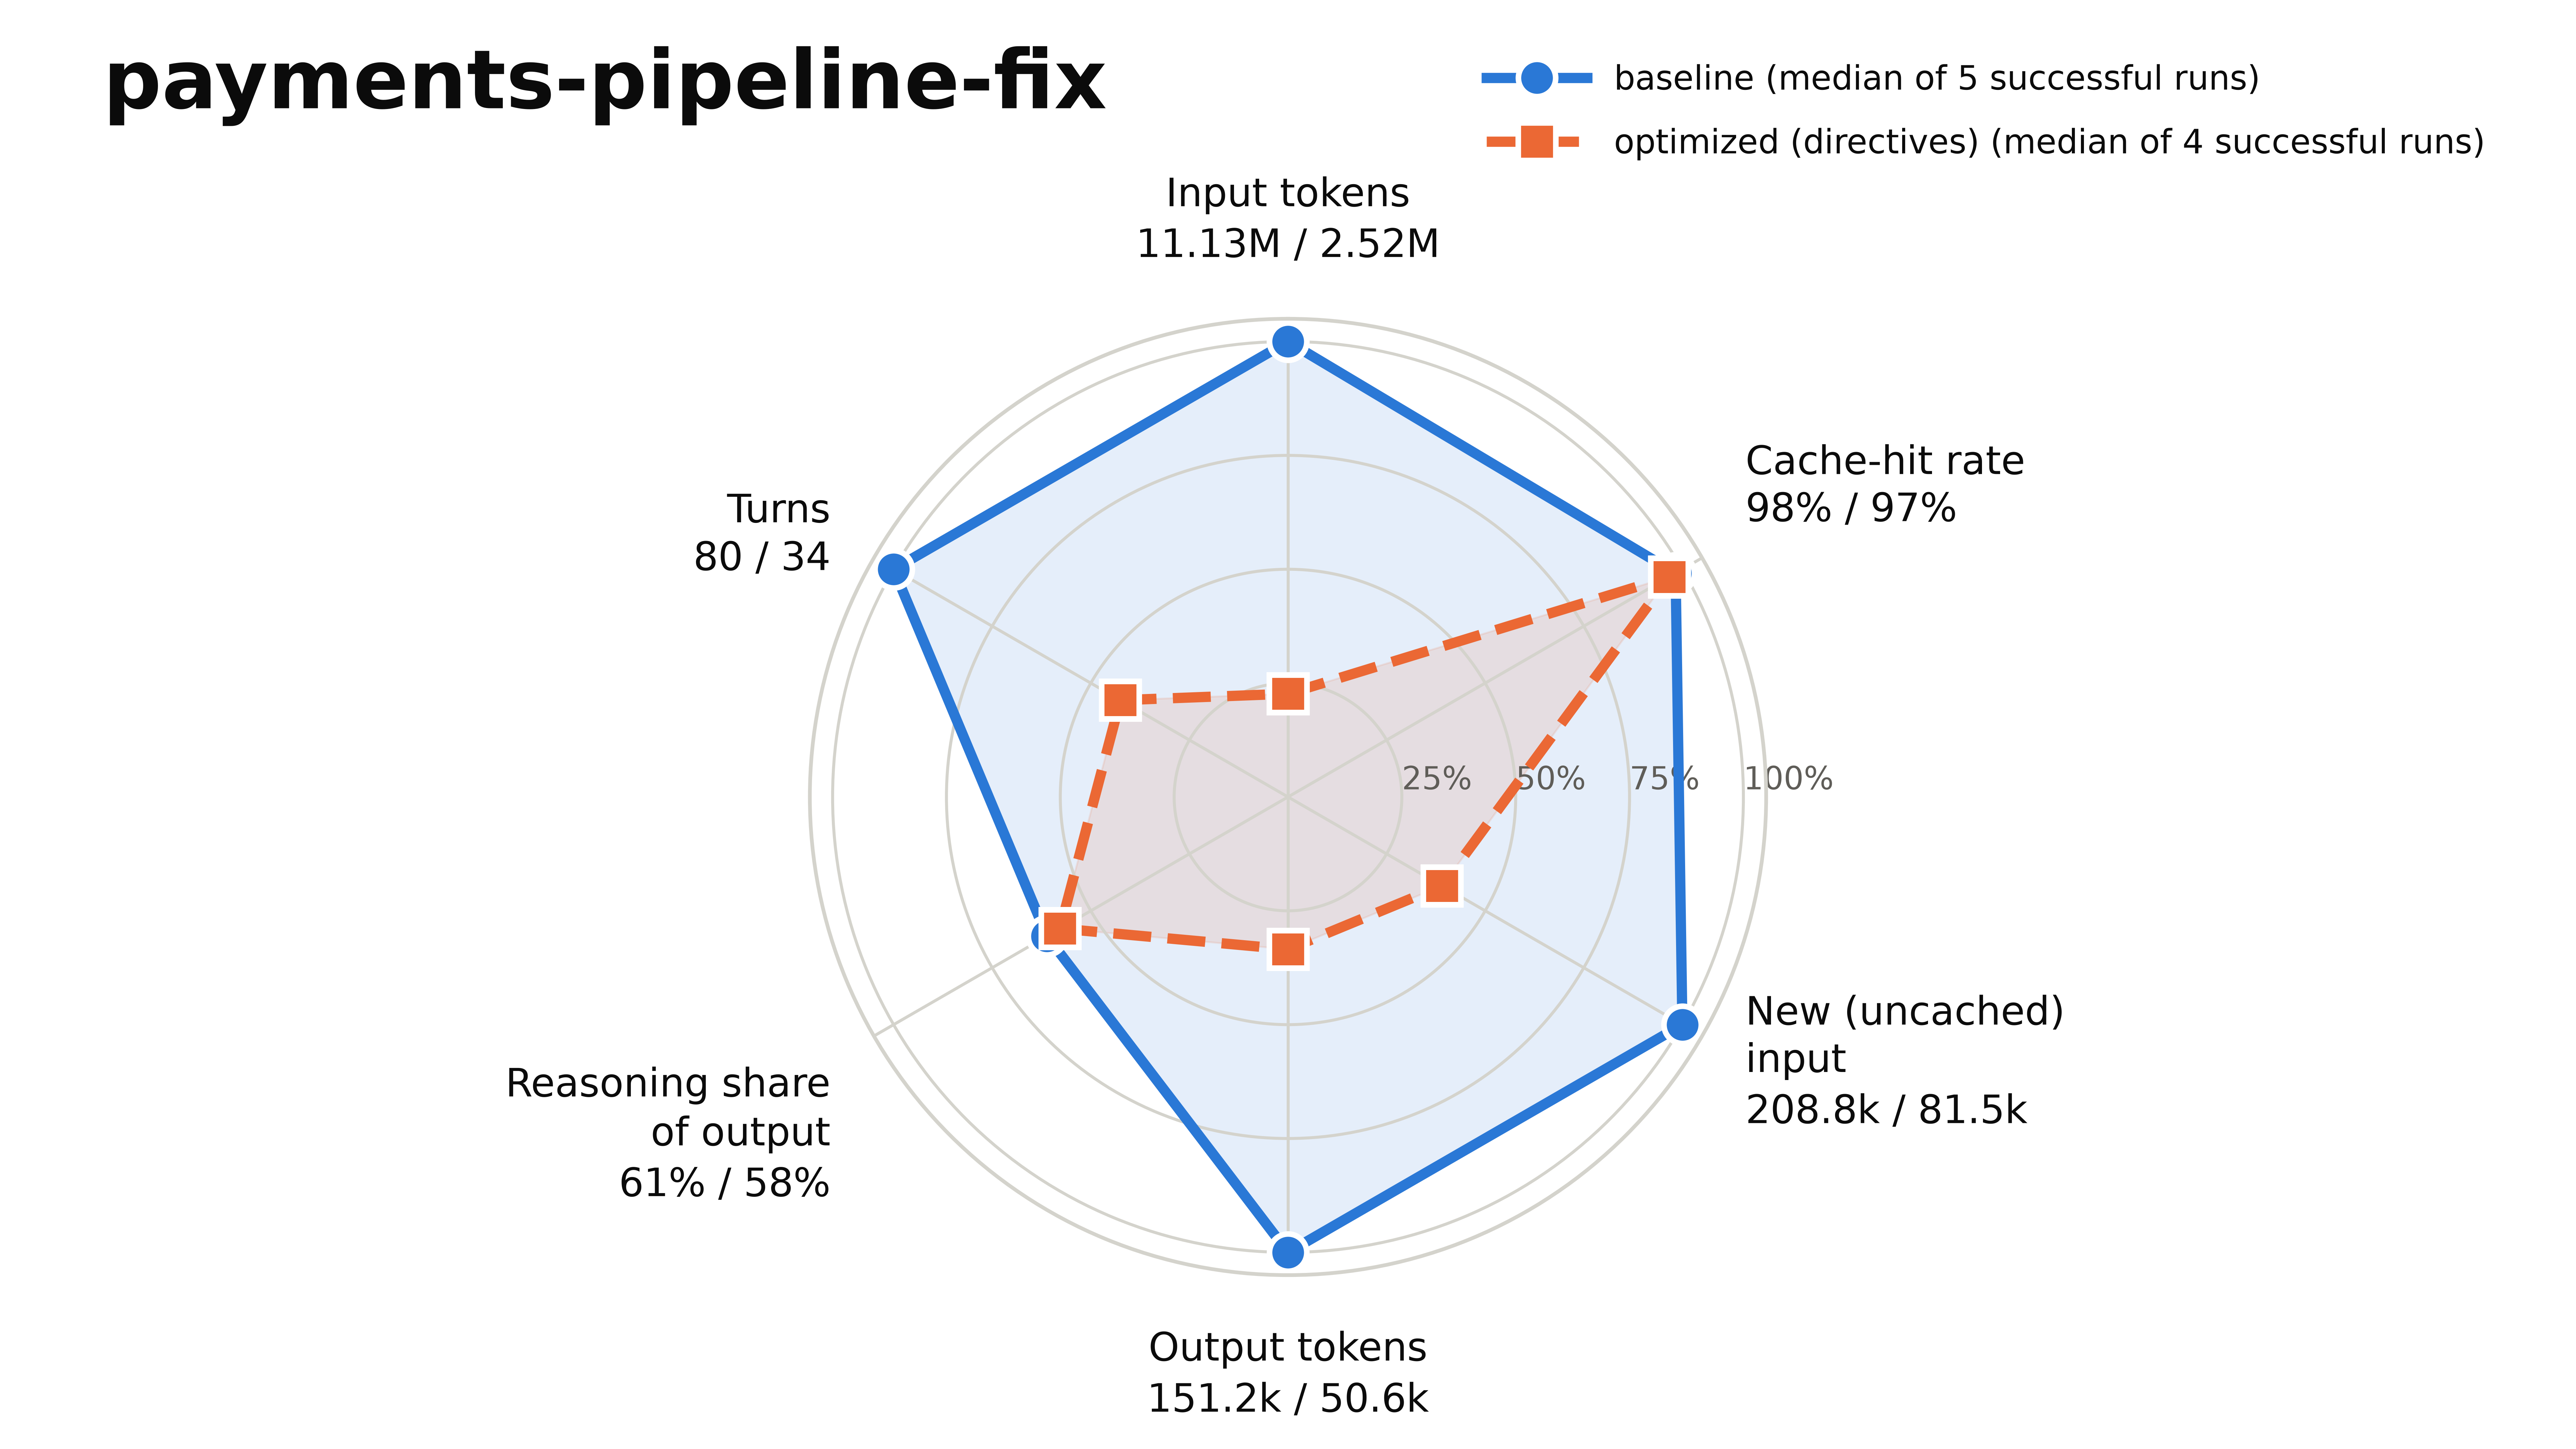
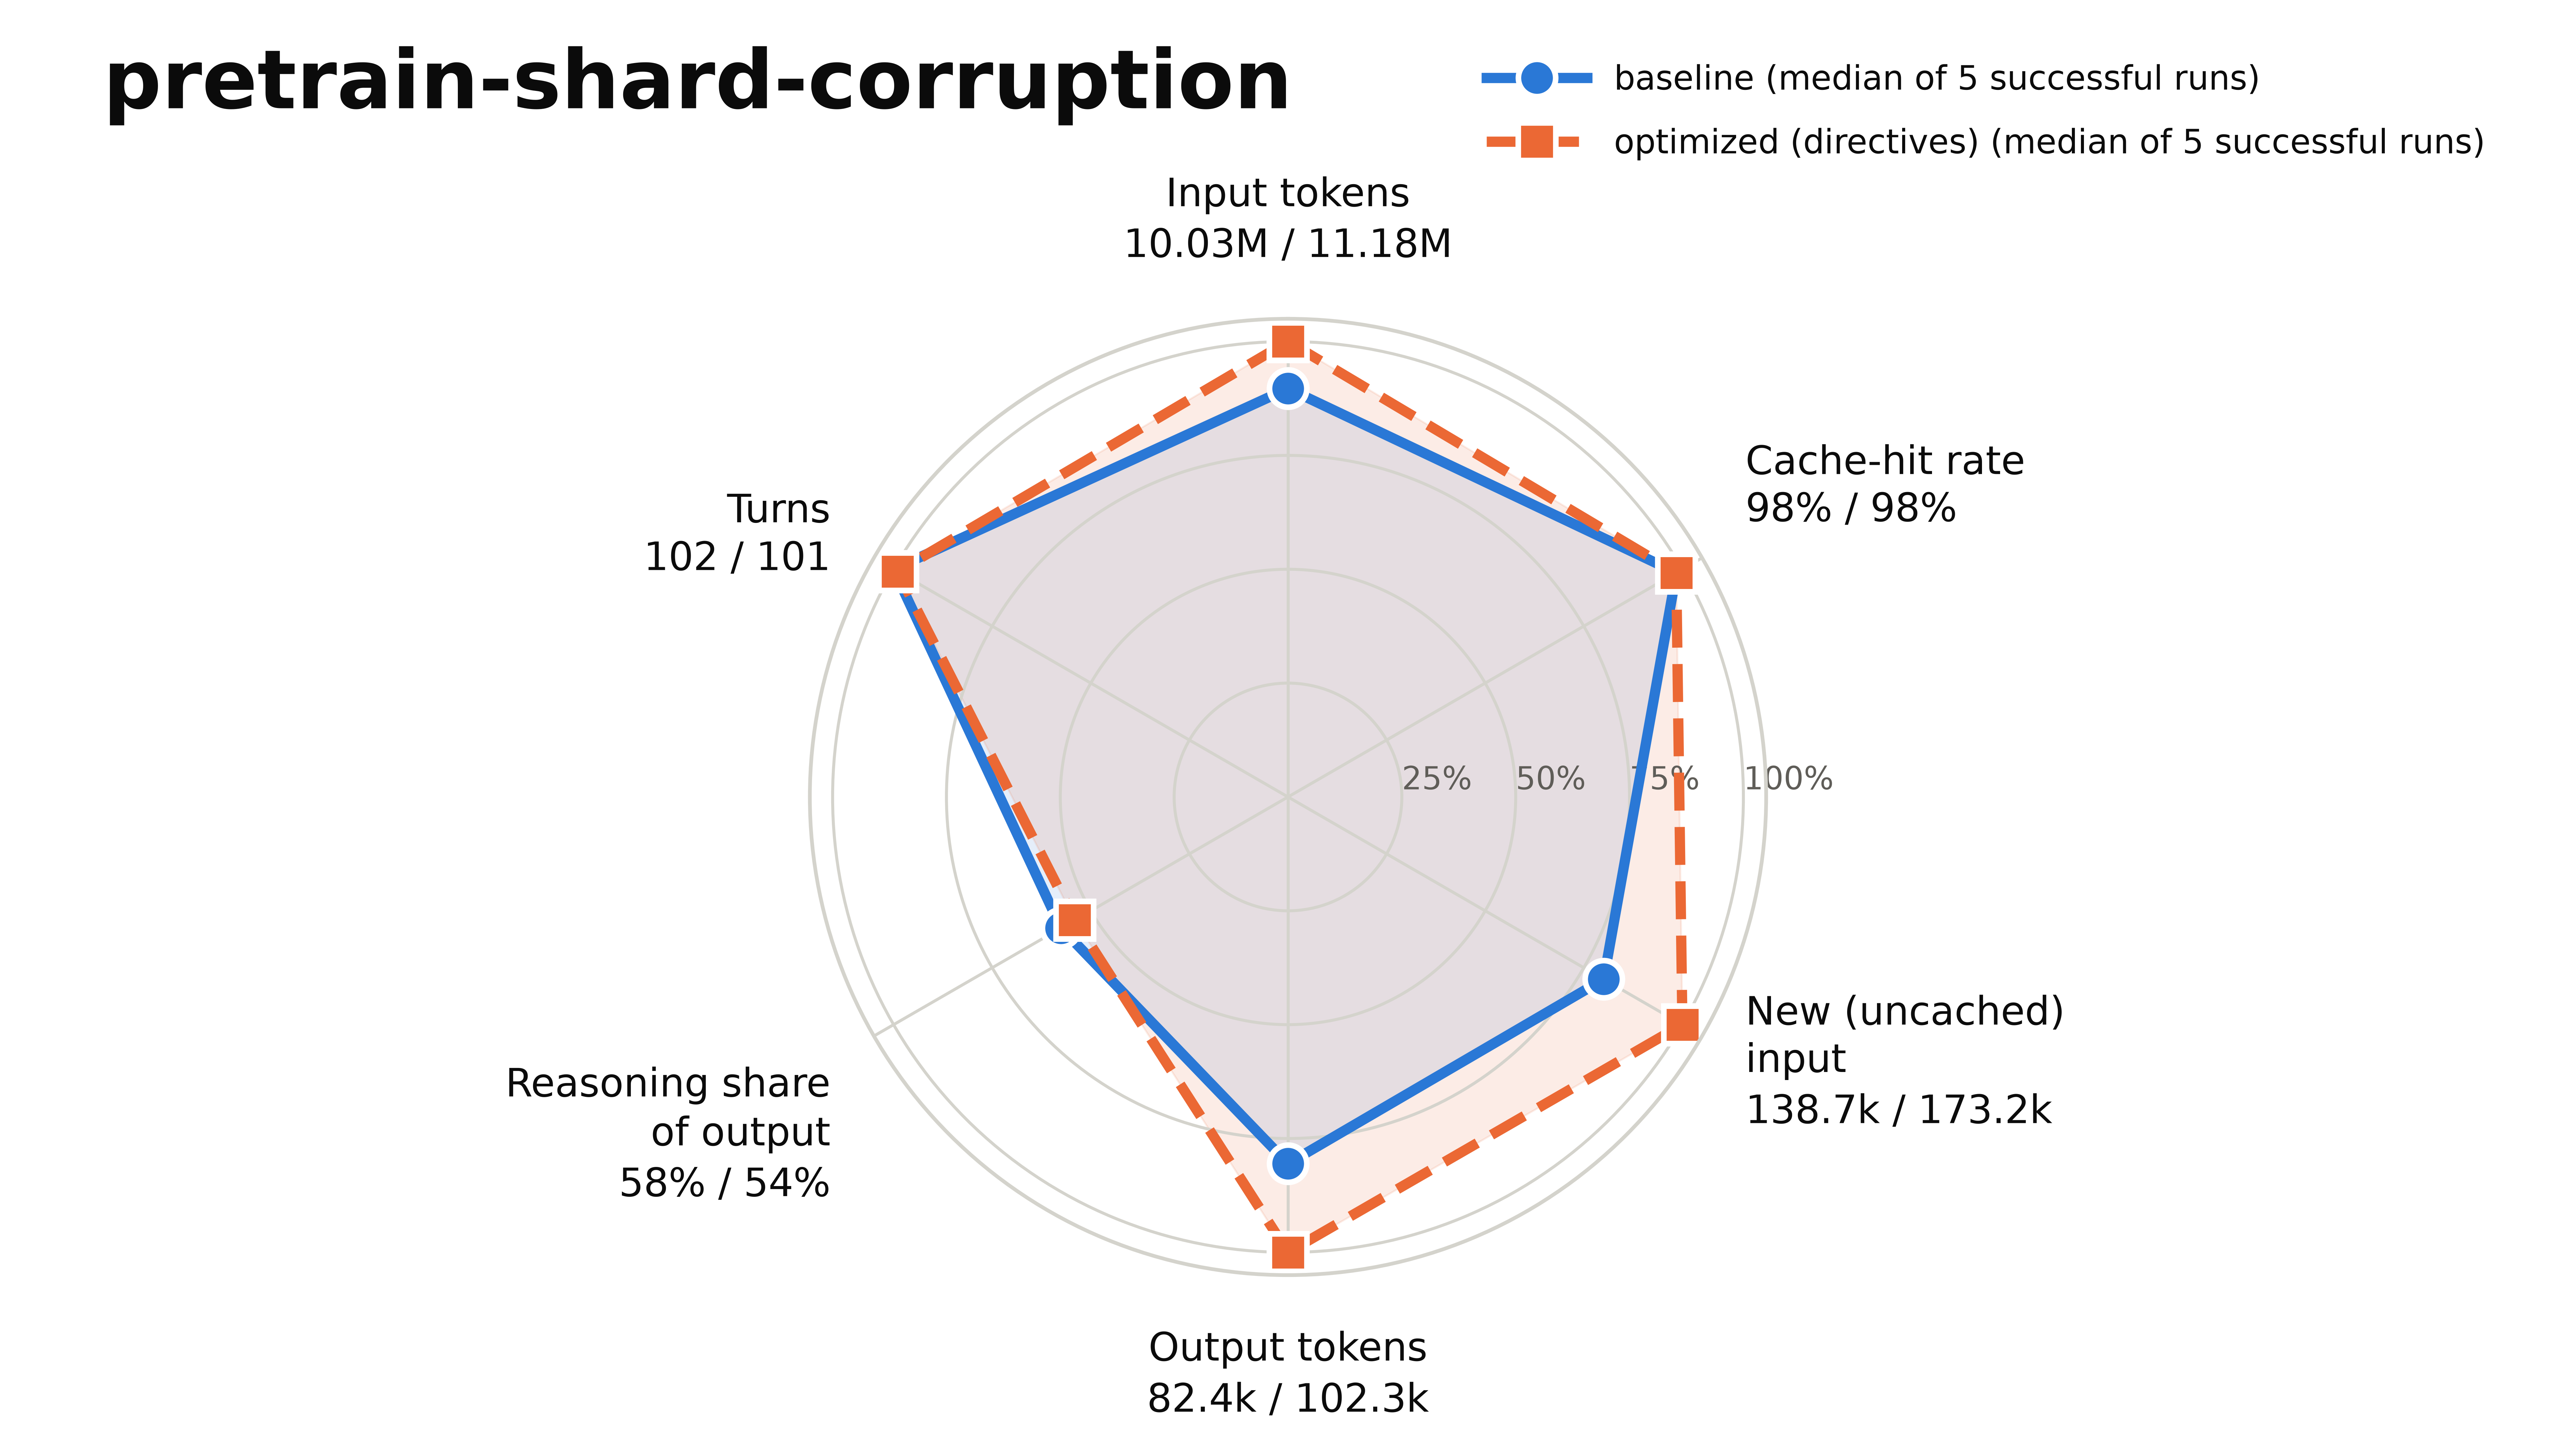
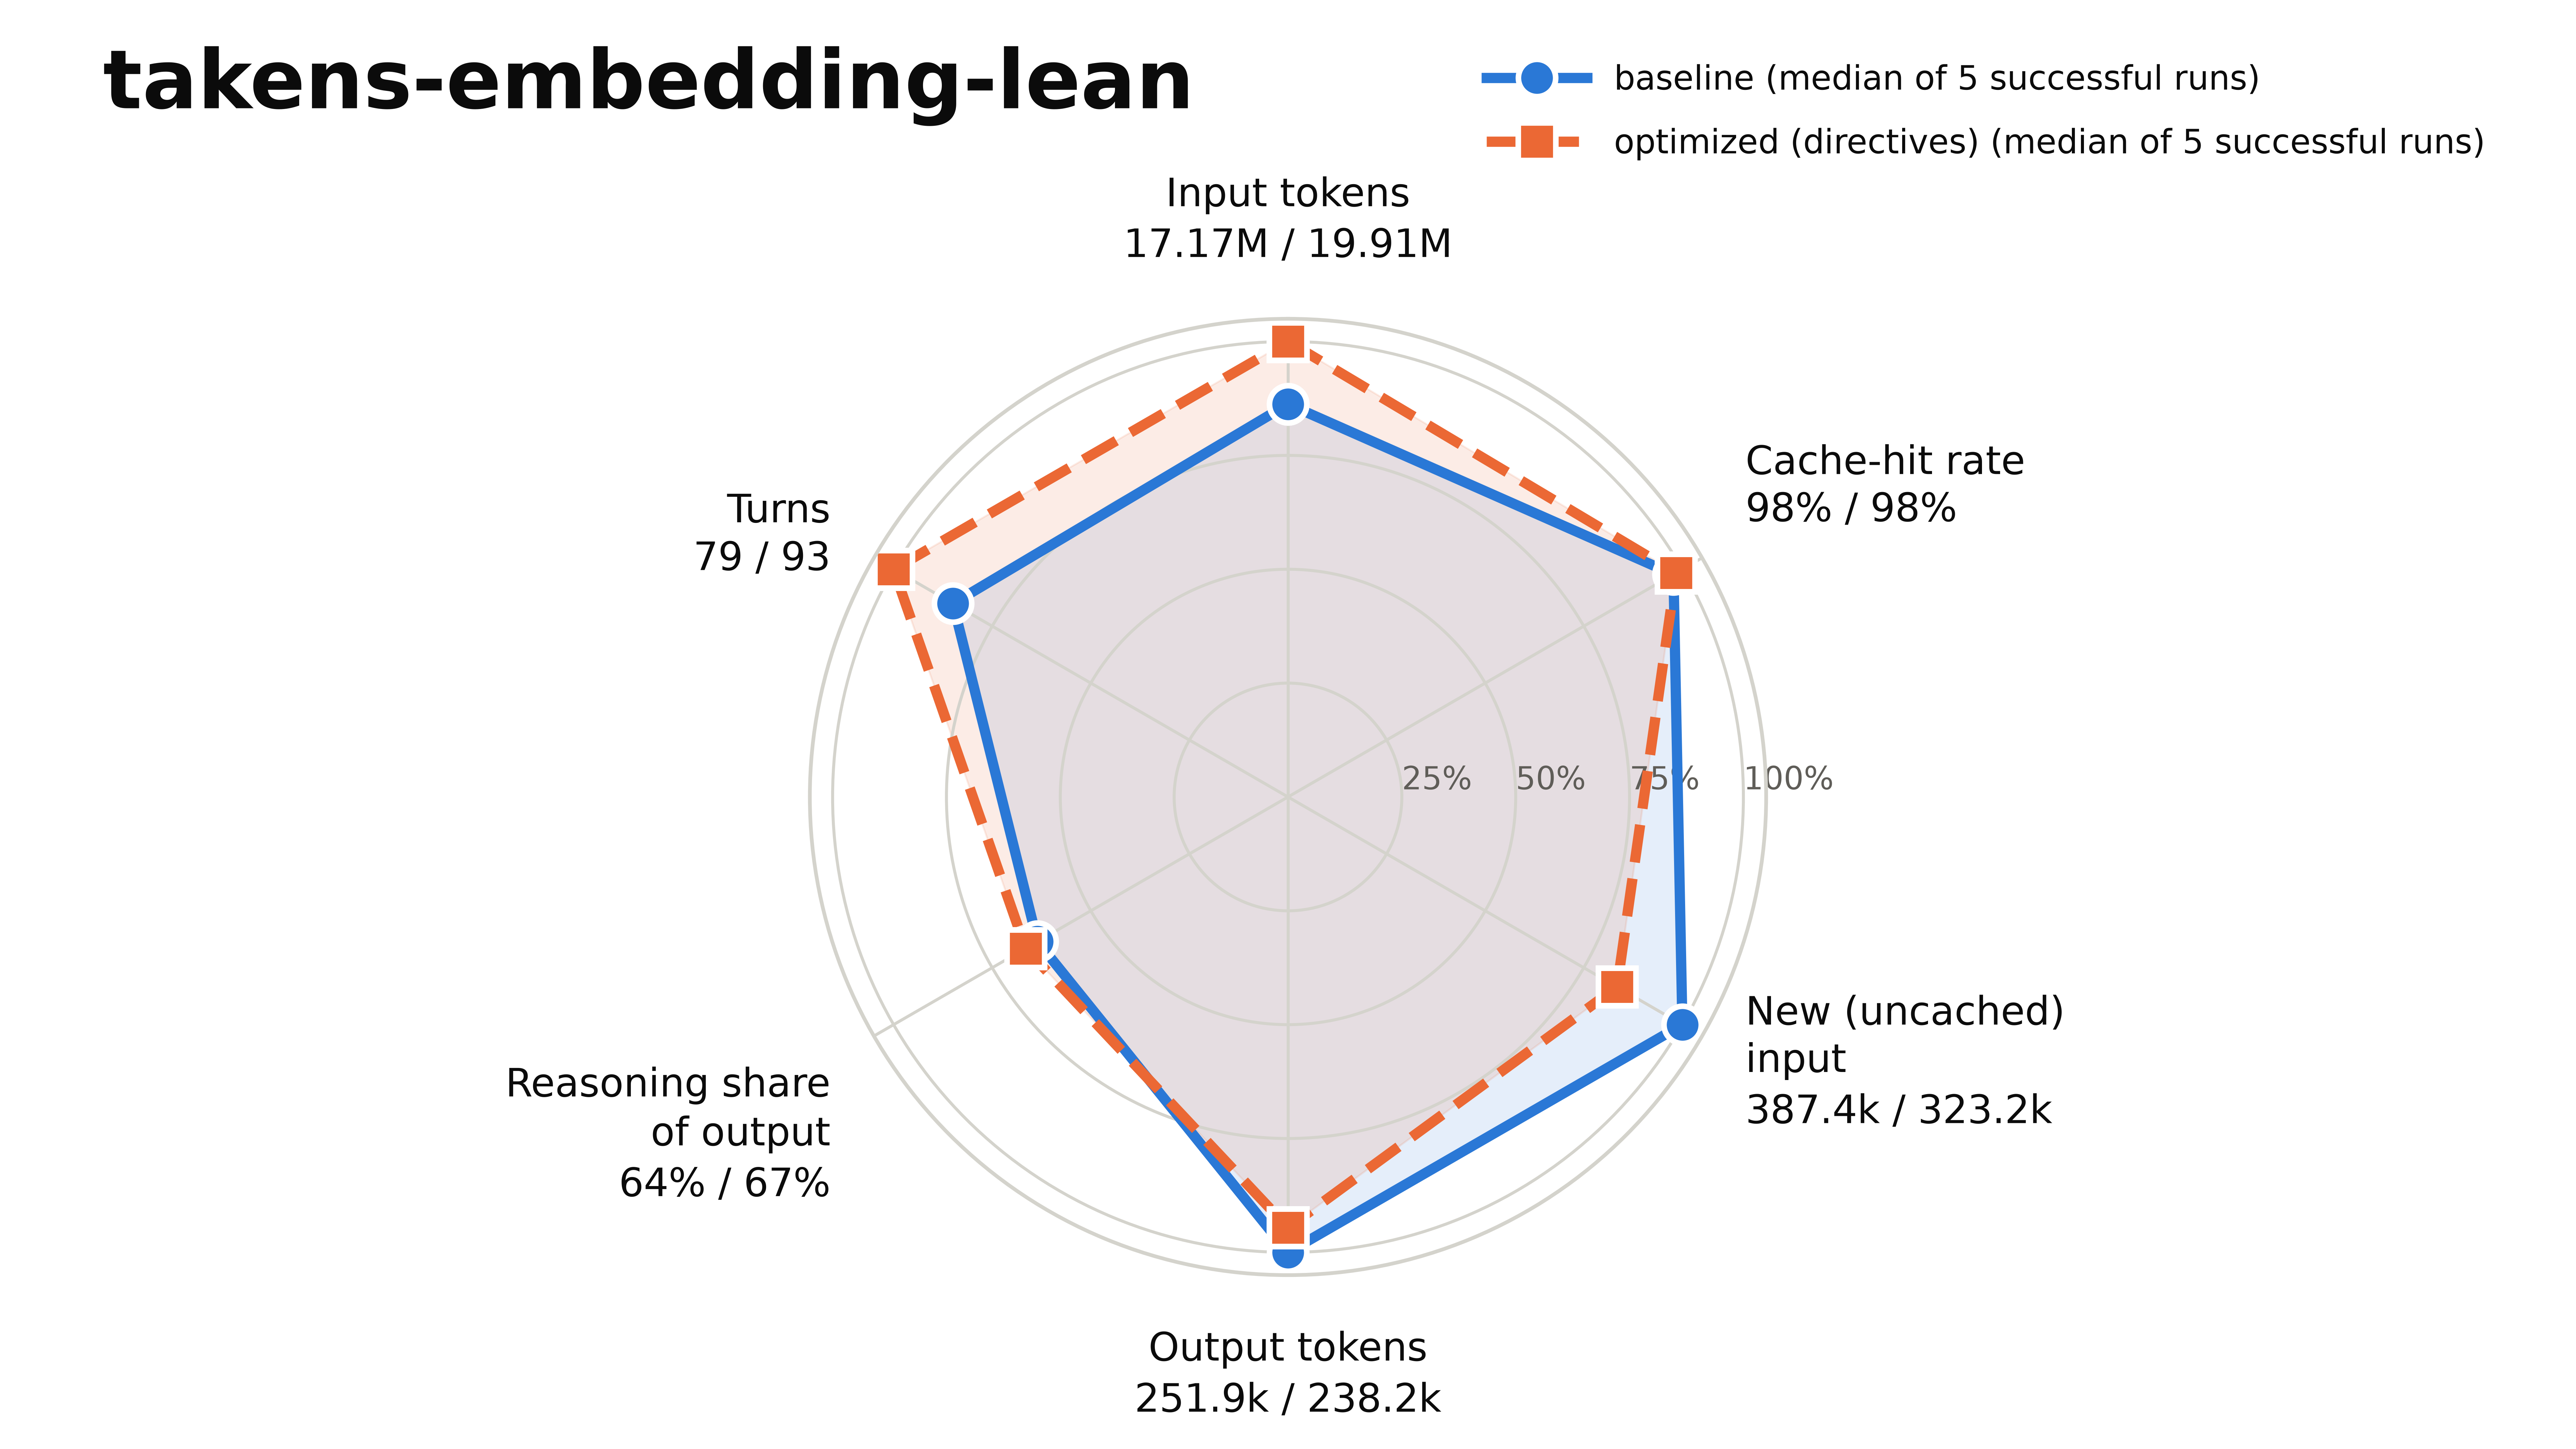
Click on a plot to zoom in.
Three patterns stand out (changes are HL estimates).
- On
payments-pipeline-fixandretro-console-socthe agent did less of everything: turns fell by 57% and 43%, and input tokens by 78% and 57%. - On
embedding-drift-monitor,risk-scorer-replayandtelecom-entity-resolutionthe cut is mostly in output and uncached input (output −49%, −18% and −12%; uncached input −27%, −20% and −22%), with turns falling less. - On the remaining five tasks the token changes are small or mixed, and on
takens-embedding-leanthe optimized arm even used more turns (+22%) and input (+20%).
Across all ten tasks the two rate axes hardly move: median cache-hit rate stays between 94% and 99%, and reasoning share shifts by at most six points. The topline savings therefore come through different levers on different tasks: fewer turns on some, less output and fresh input on others and, for wall time on layout-config-recreation2 and telecom-entity-resolution, less time running commands in the container (tool/other minutes −53% and −40%), which no token axis captures.
The driver models, which quantify within-task associations with the topline metrics, show why cost and model time move together. Model minutes are proportional to output tokens (β = 1.00, D² = 0.996), and cost depends on output and input jointly (βout = 0.60, βin = 0.34, D² = 0.99). Tokens explain wall time less well (D² = 0.68 for input and output together), because token counts do not capture time spent running commands in the container. Lower output volume was associated with lower model time and cost, while wall-time savings also depended on tool execution and other overhead. Note that the under-the-hood metrics are not independent: a run with more turns also re-reads more input and writes more output. The GLM does not separate these on its own, so we fit each predictor alone, which captures its total association with the response, and input and output together, where each coefficient holds the other fixed. This is why output’s elasticity for cost falls from 1.05 alone to 0.60 jointly. Task fixed effects account for stable differences between tasks; within-task associations may still reflect shared causes.
The tables below fit wall minutes and cost to each of the six metrics in the Kiviat plots, one at a time.
| Predictor (wall minutes) | Elasticity | Within-task deviance explained |
|---|---|---|
| Input tokens | 0.75 | 66% |
| Cache-hit rate | +39% per pt* | 35% |
| New (uncached) input | 1.11 | 53% |
| Output tokens | 1.08 | 59% |
| Reasoning share | +1.4% per pt | 2% |
| Turns | 1.11 | 61% |
Turns, output and uncached input each scale wall time slightly more than one-for-one (elasticities of 1.08-1.11) and explain 53-61% of its within-task variation. Total input explains the most (66%) but scales less than proportionally (0.75), as most of it is re-read from the prompt cache, which is fast and cheap. Reasoning share explains almost nothing (2%): output volume is more strongly associated with wall time than reasoning share in these runs. The positive cache-hit coefficient most likely reflects session length rather than a lever, since longer sessions re-read more of their own cached history and so raise their hit rate.
| Predictor (cost) | Elasticity | Within-task deviance explained |
|---|---|---|
| Input tokens | 0.69 | 91% |
| Cache-hit rate | +28% per pt | 33% |
| New (uncached) input | 1.16 | 93% |
| Output tokens | 1.05 | 93% |
| Reasoning share | +2.3% per pt | 8% |
| Turns | 0.98 | 78% |
Tokens explain cost far better than wall time, 91–93% of its within-task variation against 53–66%, as expected of a bill computed from token counts. Output tokens and uncached input move cost about one-for-one (1.05 and 1.16), while total input moves it less than proportionally (0.69), because cache reads are billed at a fraction of the price of fresh input. Turns explain 78%, with cost rising in proportion (0.98). The two rates again matter little: reasoning share explains 8%, and the cache-hit coefficient most likely reflects session length, as above. Cost, then, tracks what the agent writes and the fresh input it reads; wall time also tracks what it runs in the container.
Things to Note
Beyond the averages, a few observations stand out.
- Single runs are unreliable. On
pretrain-shard-corruption, the first optimized run took 149 minutes against 77 for the baseline, yet over five repeats the two arms’ medians were almost identical (53.3 and 52.9 minutes), which is why we report repeat-level estimates. The variation across runs, for each task, is reported in Appendix B. Anomalous runs are reported in Appendix C. - Both optimized failures stopped after a weak self-check:
layout-config-recreation2scored 97.99% pixel similarity against a 98% bar, andpayments-pipeline-fixvalidated a fix with a mock test only, wrongly concluding that no Kafka broker was available, and stopped after 4.5 minutes. This fits the directive that tells the agent to stop once one check passes; a refinement would require that check to exercise the real system the task provides. Weak self-checks also occurred in the baseline: the one baseline failure, onretro-console-soc, validated against a reference emulator the agent wrote itself. - On
layout-config-recreation2, the optimized arm wrote more output (+15%) yet finished faster, because it spent less time waiting on long-running search scripts in the container: it stopped once a render check passed, while the baseline kept searching for a closer match. Taken together, the shorter successful runs and the optimized arm’s one failure on this task suggest a possible trade-off between earlier stopping and sufficient validation.
Closing Thoughts
The directives evaluated here are CLAUDE.md advice that the model may or may not follow on a given step, and they are high level by necessity, since the models expose no low-level API for requesting a specific behavior. A harness-based evaluation is the logical next step (Appendix D sketches a stop hook that runs the real check before the agent may finish), and the field is already moving in that direction.
Since the beginning of ’26, there has been a flurry of research in harness optimization [4], much of it on harnesses that adapt automatically: auto-compaction [5, 6], meta-reasoning [7, 8], loop-based setups and self-evolving harnesses [9, 10] and, more recently, recursive self-improvement (RSI) applied to the harness itself [11].
How do the compiler-inspired directives interplay with these directions? Harness search has independently discovered mechanisms analogous to some of the directives, including fusing an edit with its test into one tool call and archiving long outputs behind a handle [12]; another study found that jointly evolving tools, middleware and memory alongside prompts outperformed prompt-only approaches [13]. Seeding such a search with the directives, and compiling the survivors into the harness rather than CLAUDE.md, would be a natural follow-up.
Evaluating that follow-up raises a broader question: how much does each optimization add beyond what the harness already does, and at what cost? Isolating that incremental contribution requires a common baseline and a consistent reporting protocol. A shared reference harness, evaluated on held-out tasks with success rate, cost and execution time reported together, would make those contributions easier to assess, helping the community identify complementary ideas, reduce duplication and advance the cost-performance frontier.
Notes
- 1 Agent runs are stochastic, so we repeat each configuration five times. Alternating the arm order reduces systematic order effects but does not guarantee equivalent prompt-cache state. ↩︎
- 2 Run times and token counts are right-skewed, and a single extreme run can dominate a mean or a t-test at n = 5. HL uses all pairwise ratios, so one outlier moves only a few of them. The log scale turns multiplicative effects into shifts. ↩︎
- 3 The geometric mean keeps long or expensive tasks from dominating the summary. ↩︎
- 4 The median and MAD are themselves robust, so an outlier cannot mask itself by inflating the spread, as it can with mean ± k·SD. HL already bounds each run’s influence, so removing flagged runs is unnecessary. ↩︎
- 5 Time and cost are positive, right-skewed, and their conditional variance is modeled as proportional to the square of the conditional mean, which is the Gamma family’s assumption. Task fixed effects remove differences between tasks, so
βis estimated from variation within tasks across all successful runs. ↩︎
Appendix
A. Geometric mean of % changes
- Turn each task’s % change into a ratio: r = 1 + p/100. For example, −68.5% becomes 0.315 and +3.1% becomes 1.031.
- Take the log of each ratio and average the logs across the 10 tasks.
- Convert back: 100 * [exp(mean) − 1]%.
B. Variation across runs
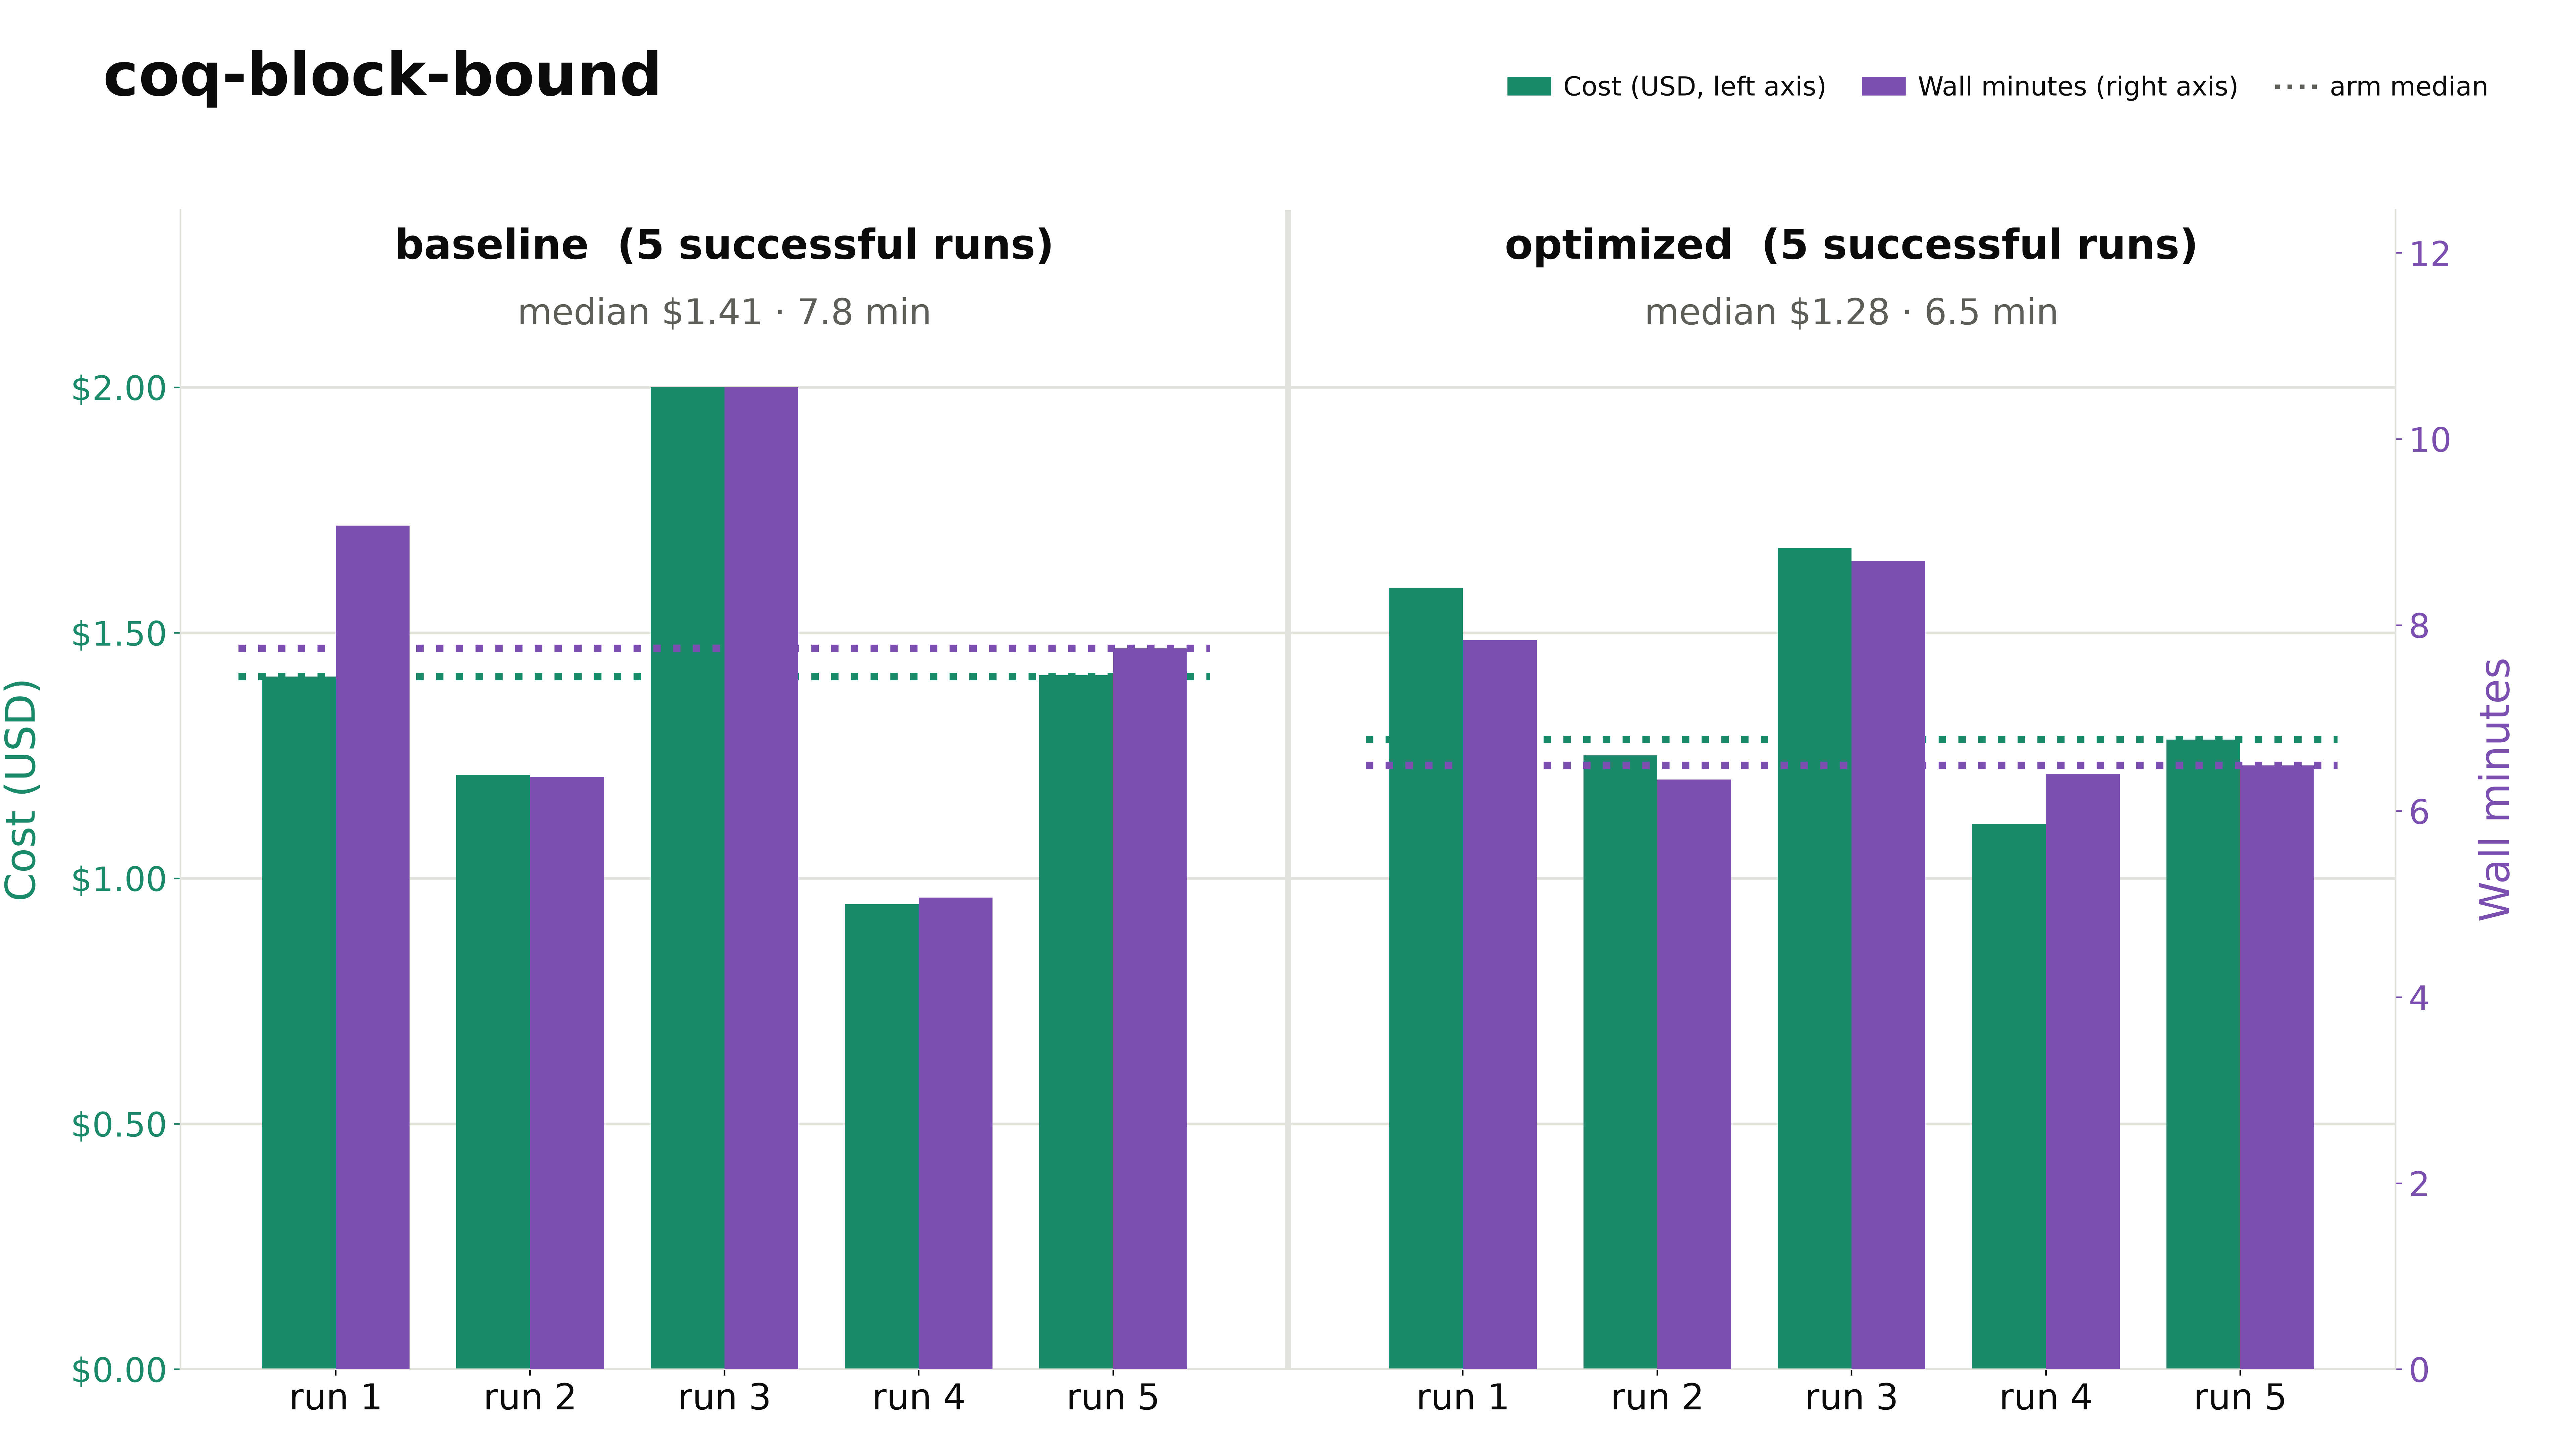
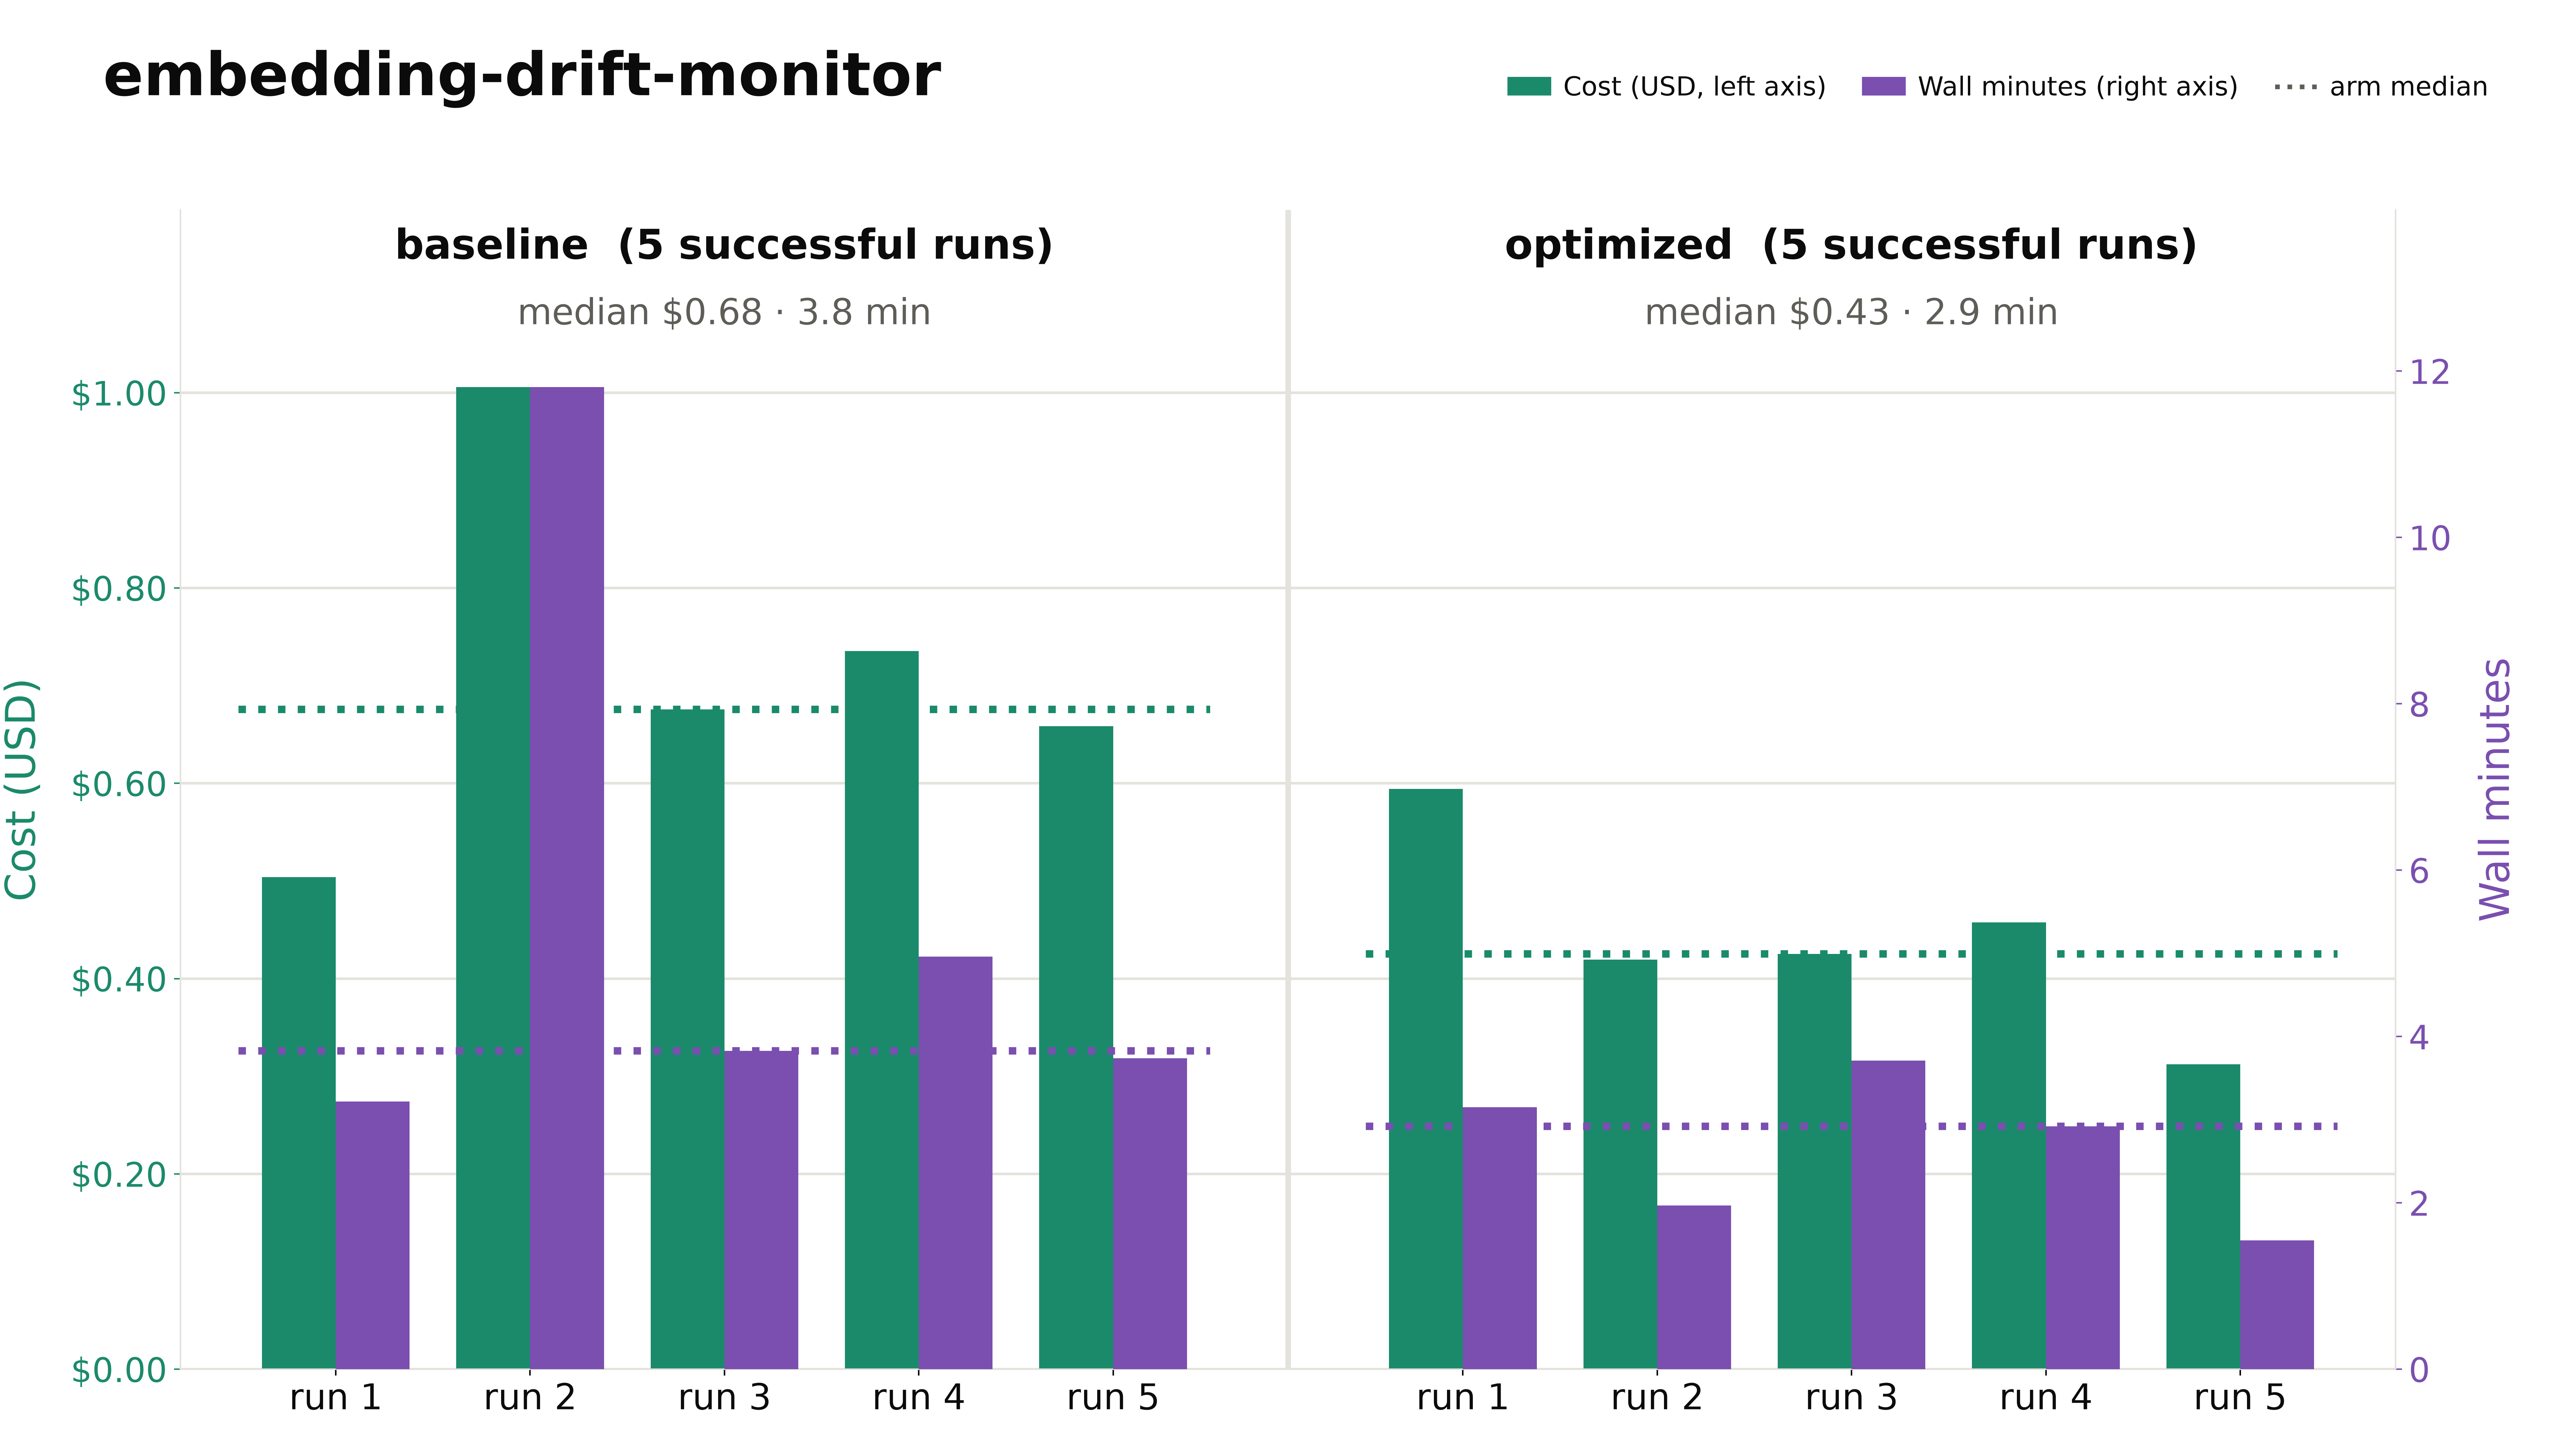
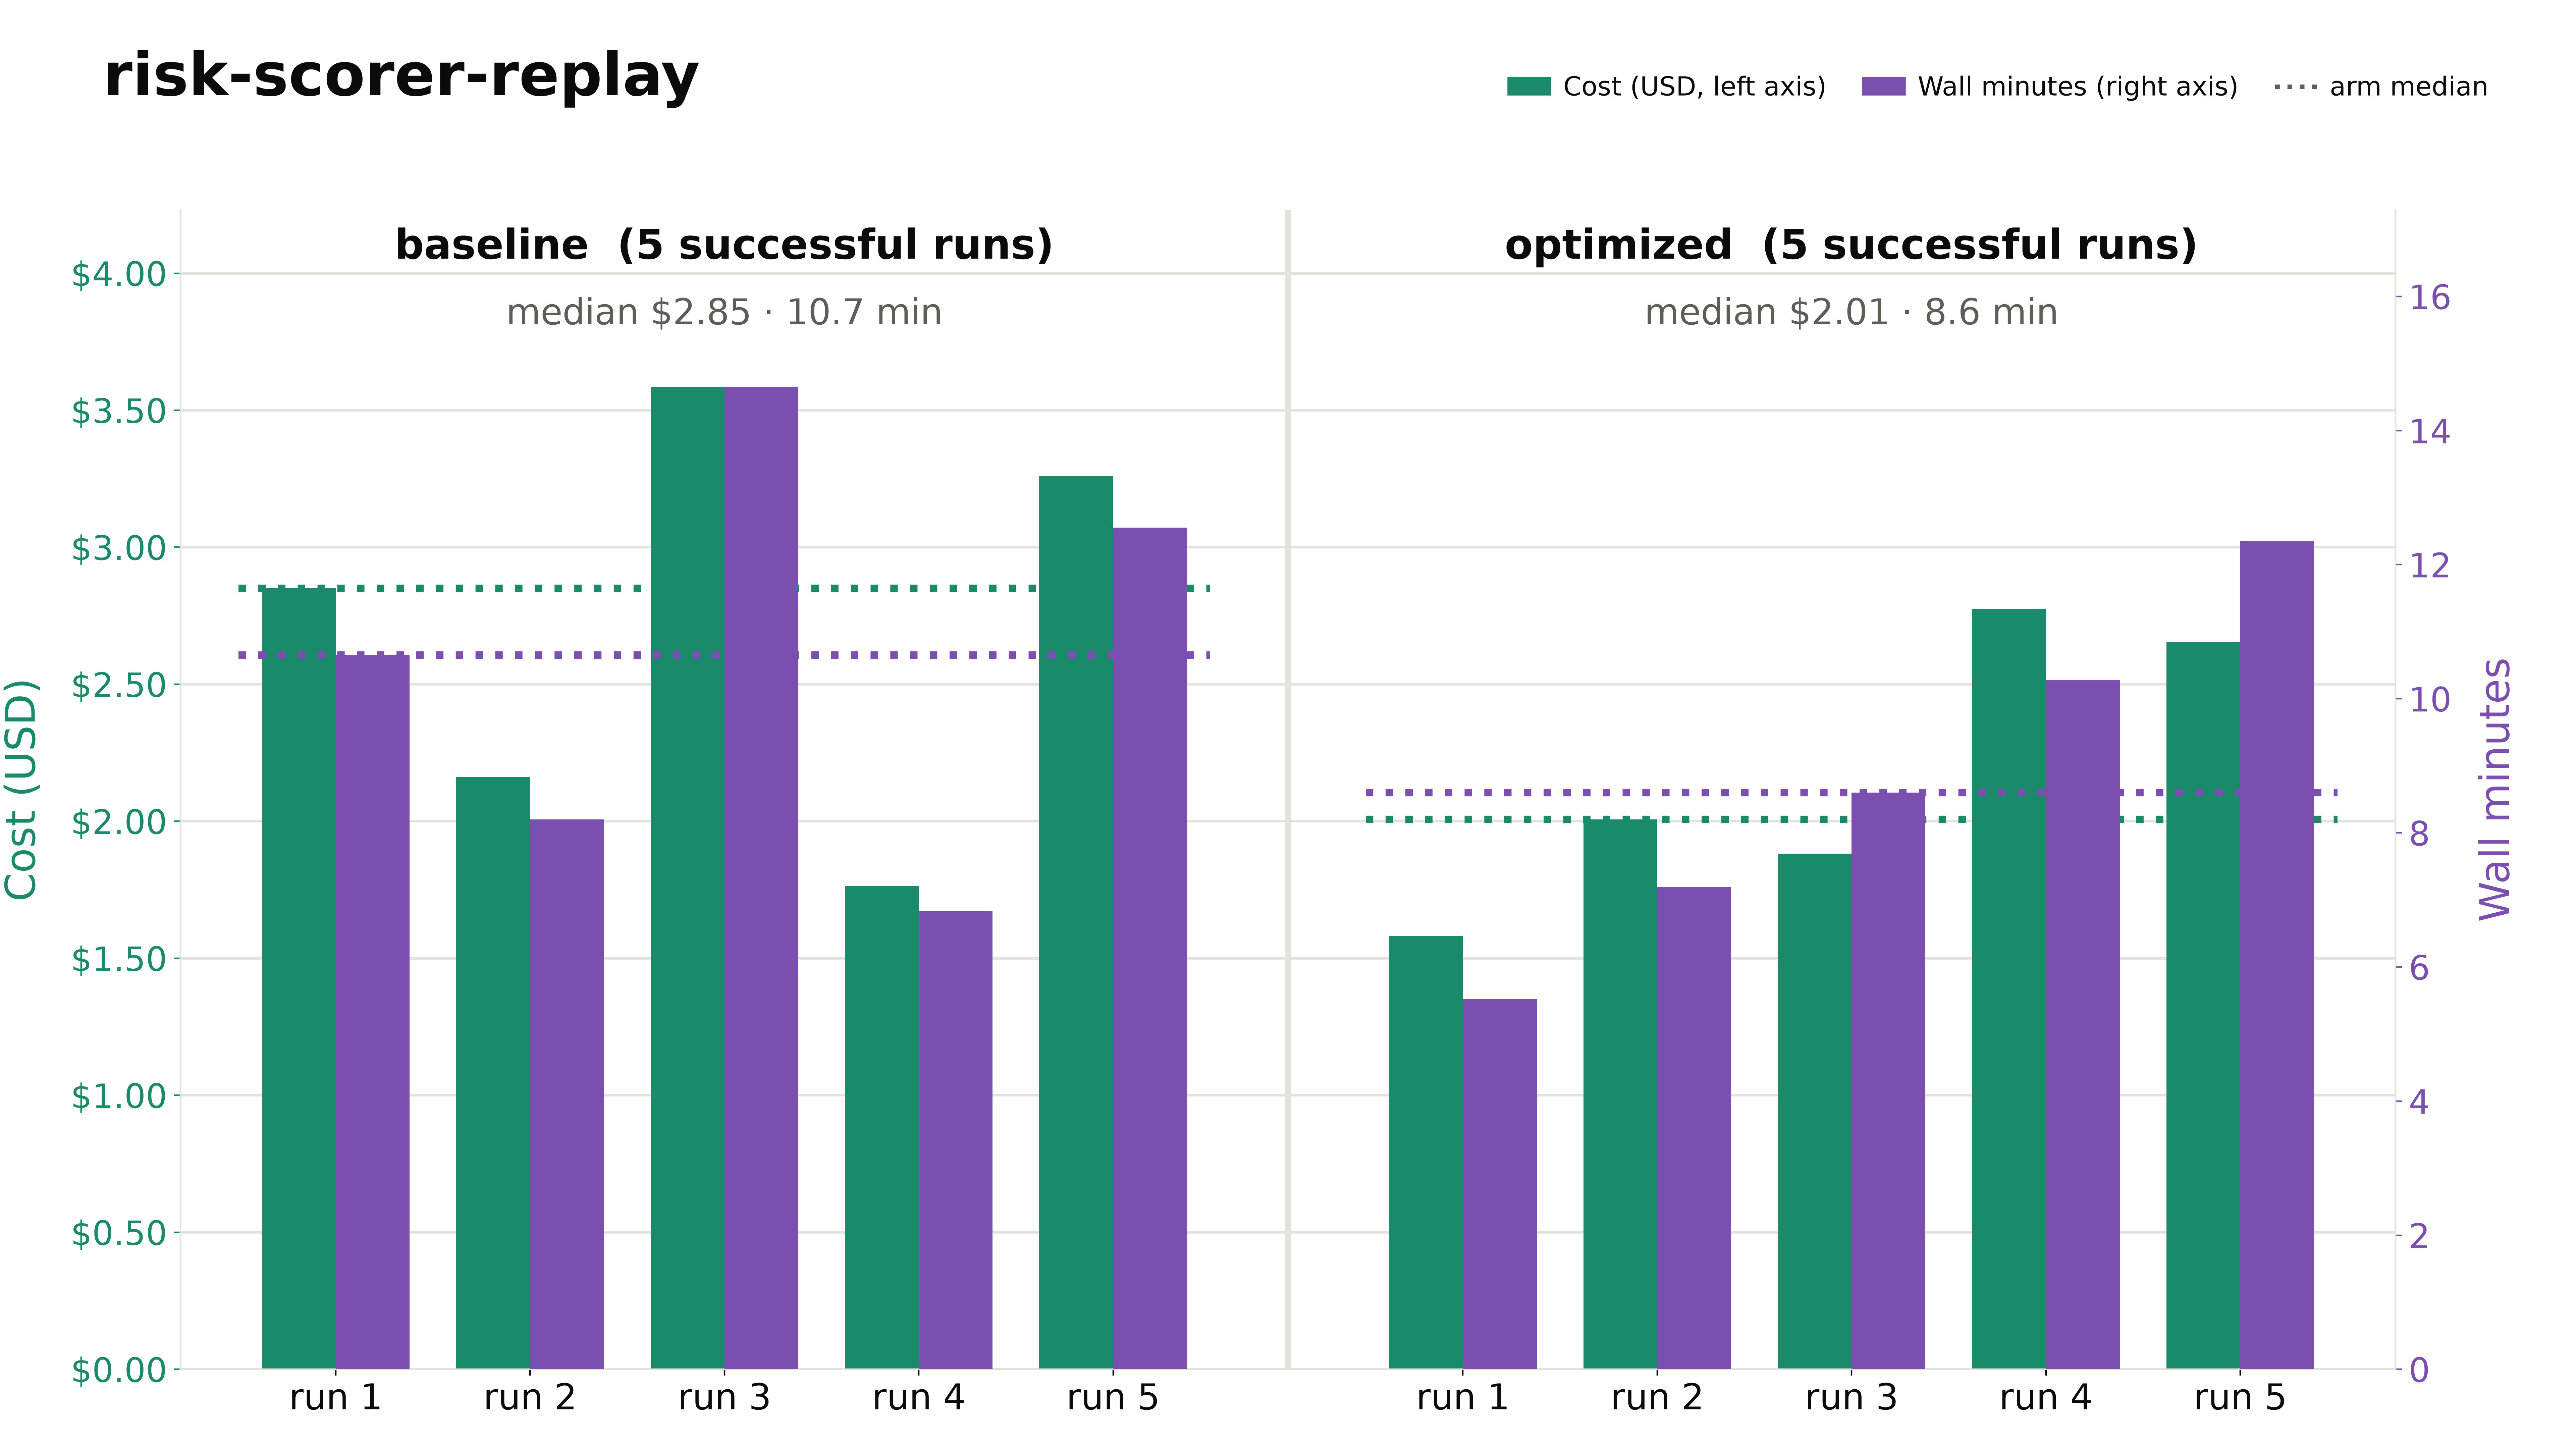
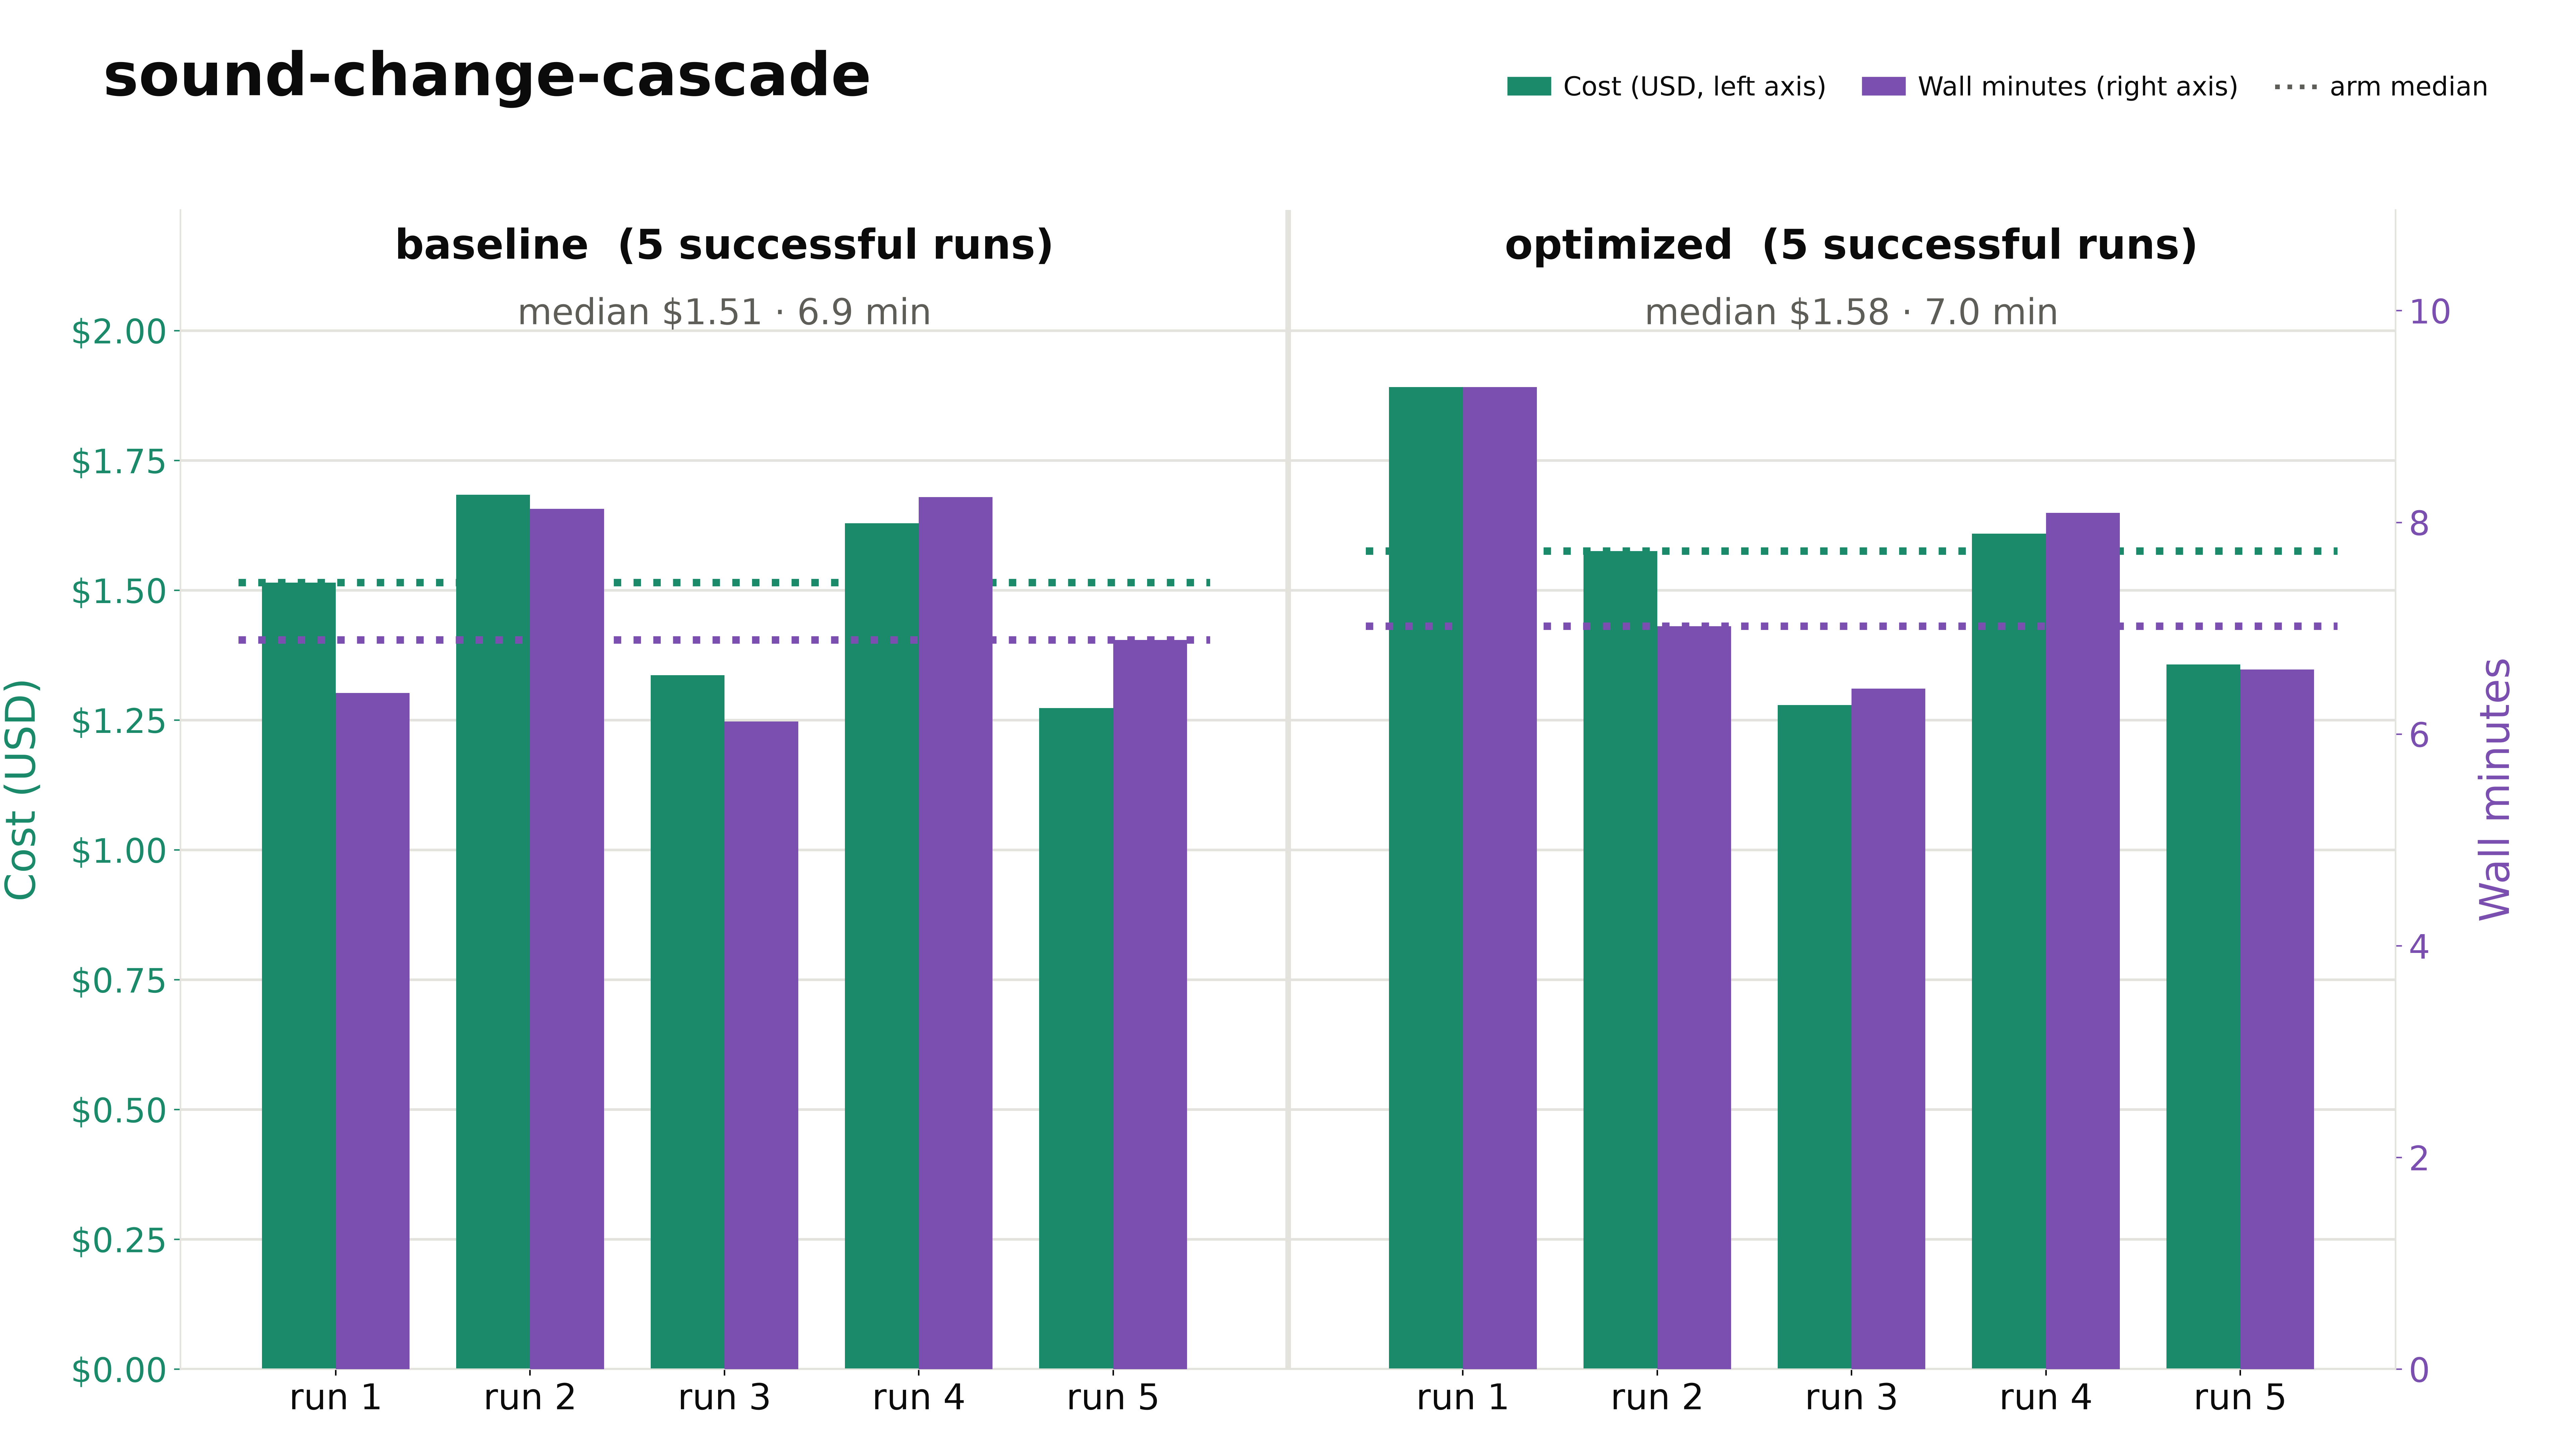
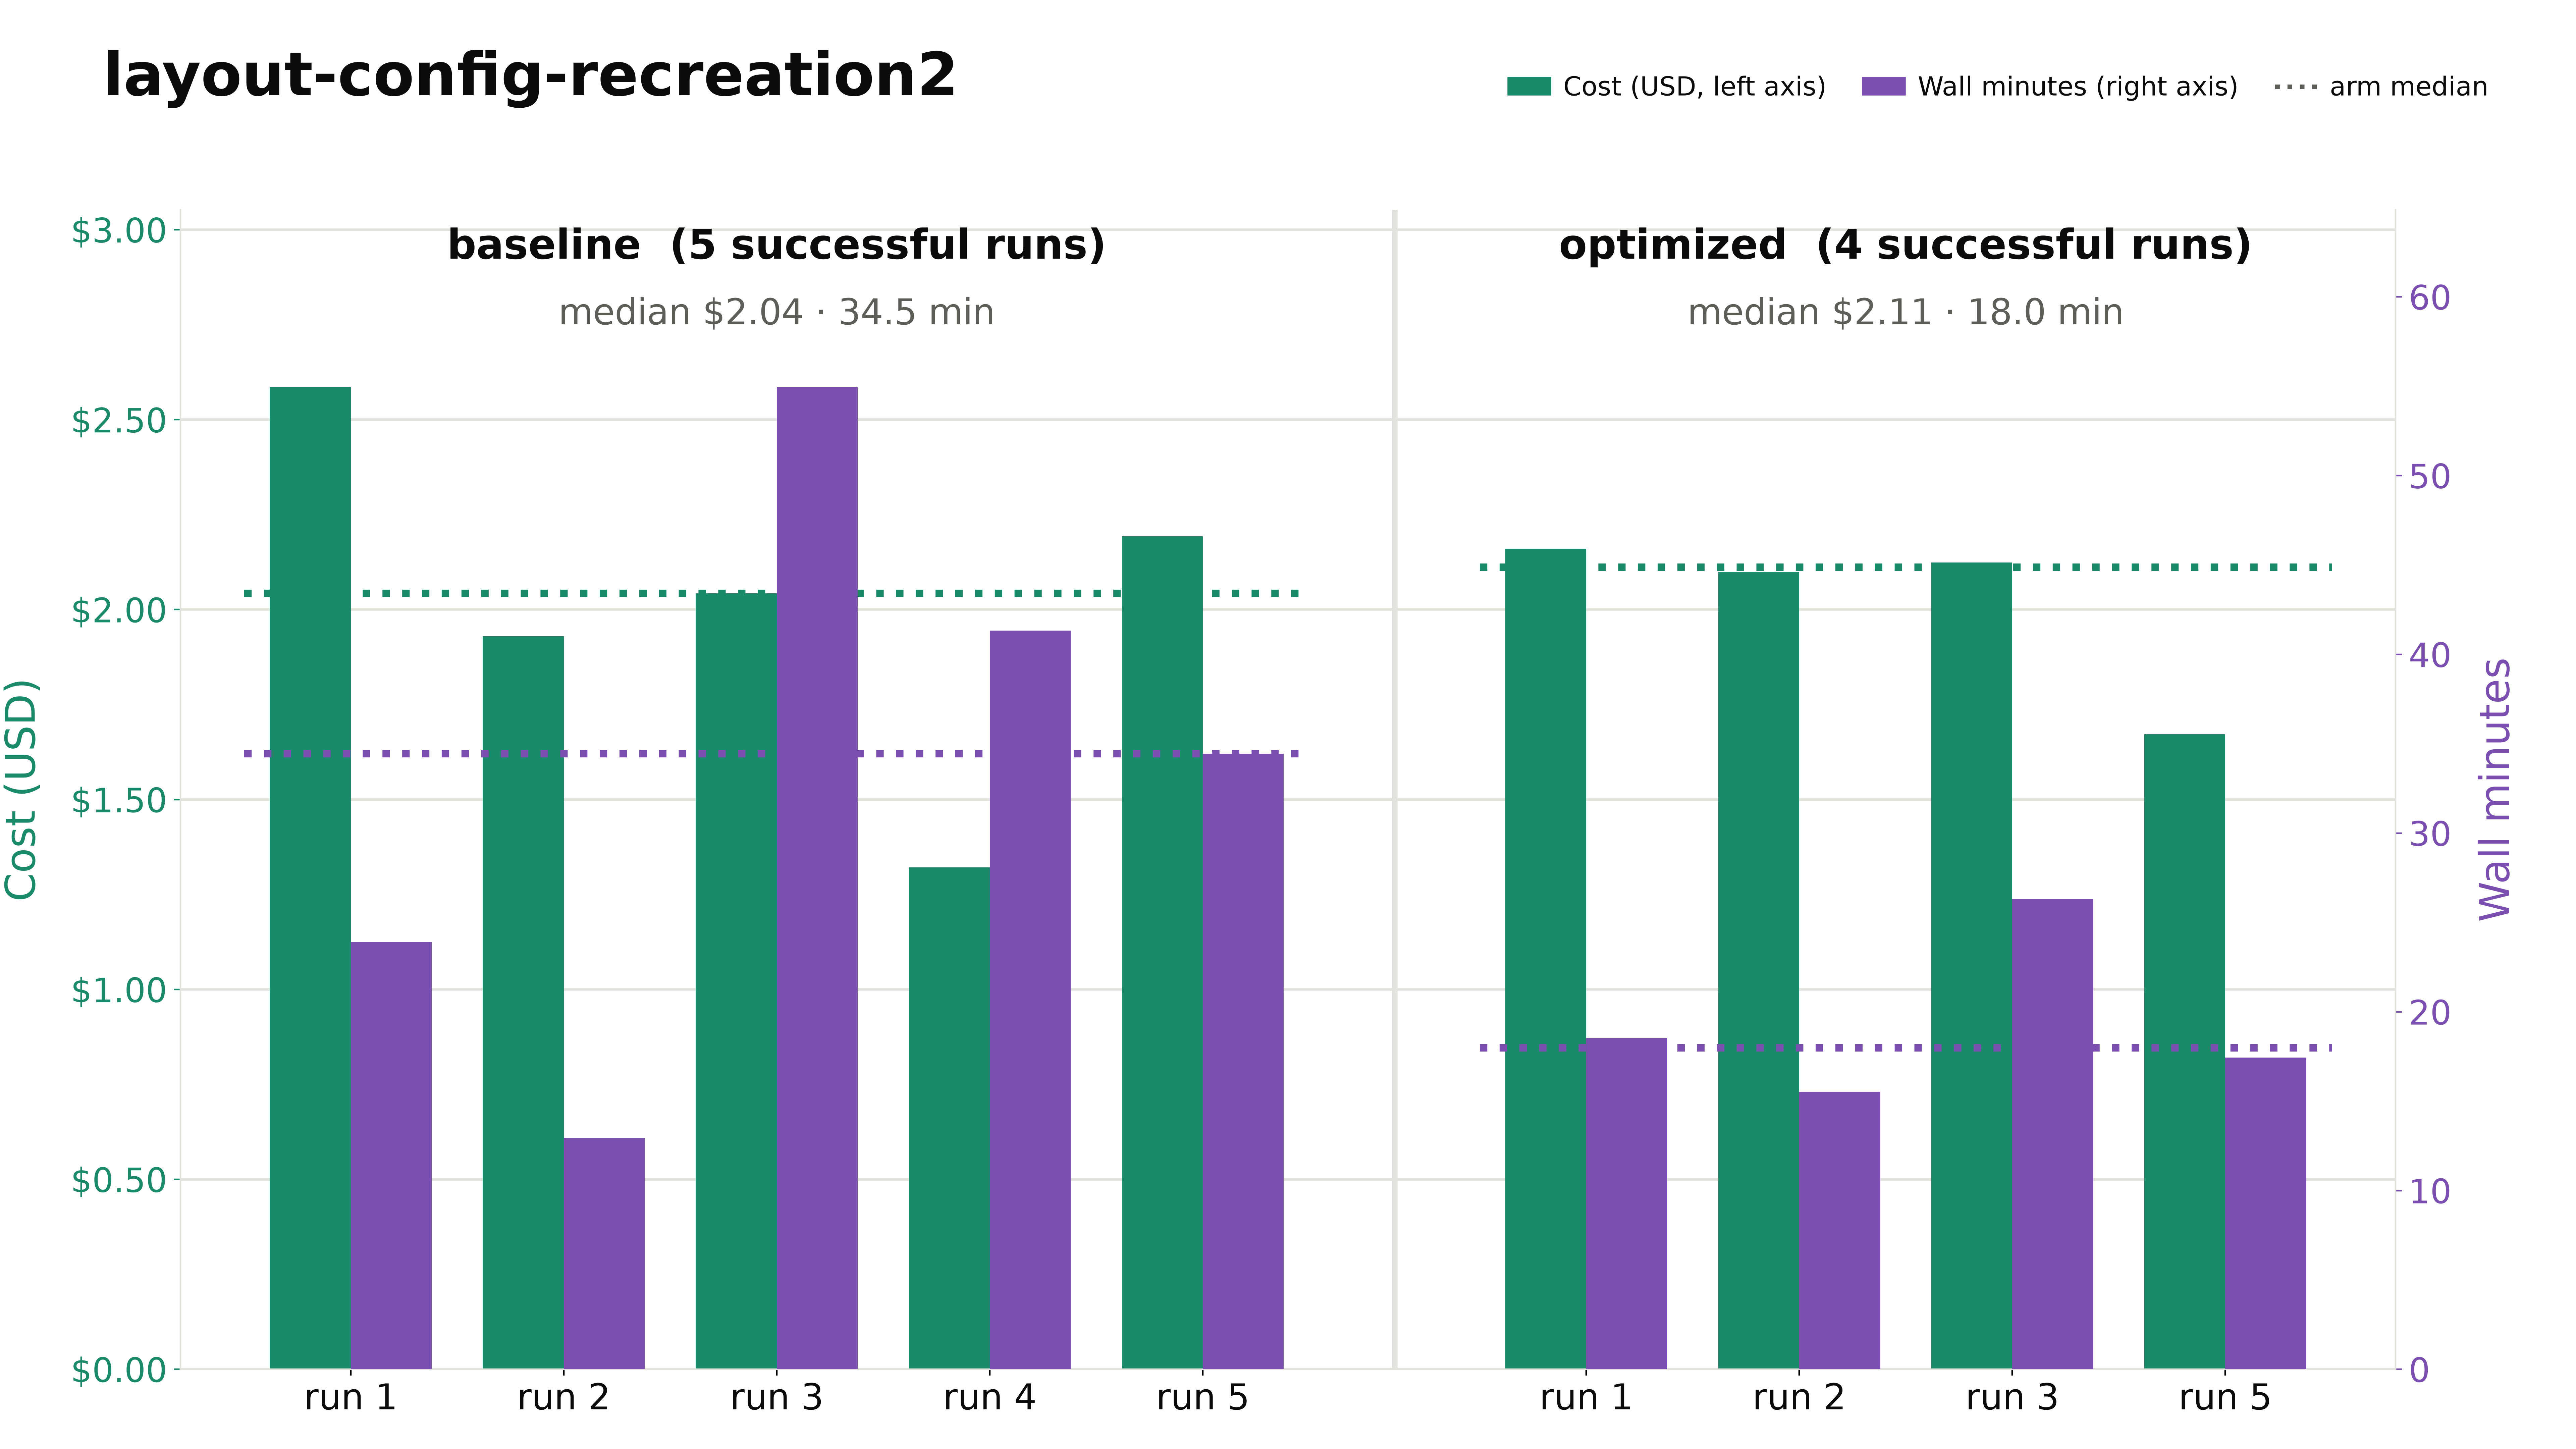
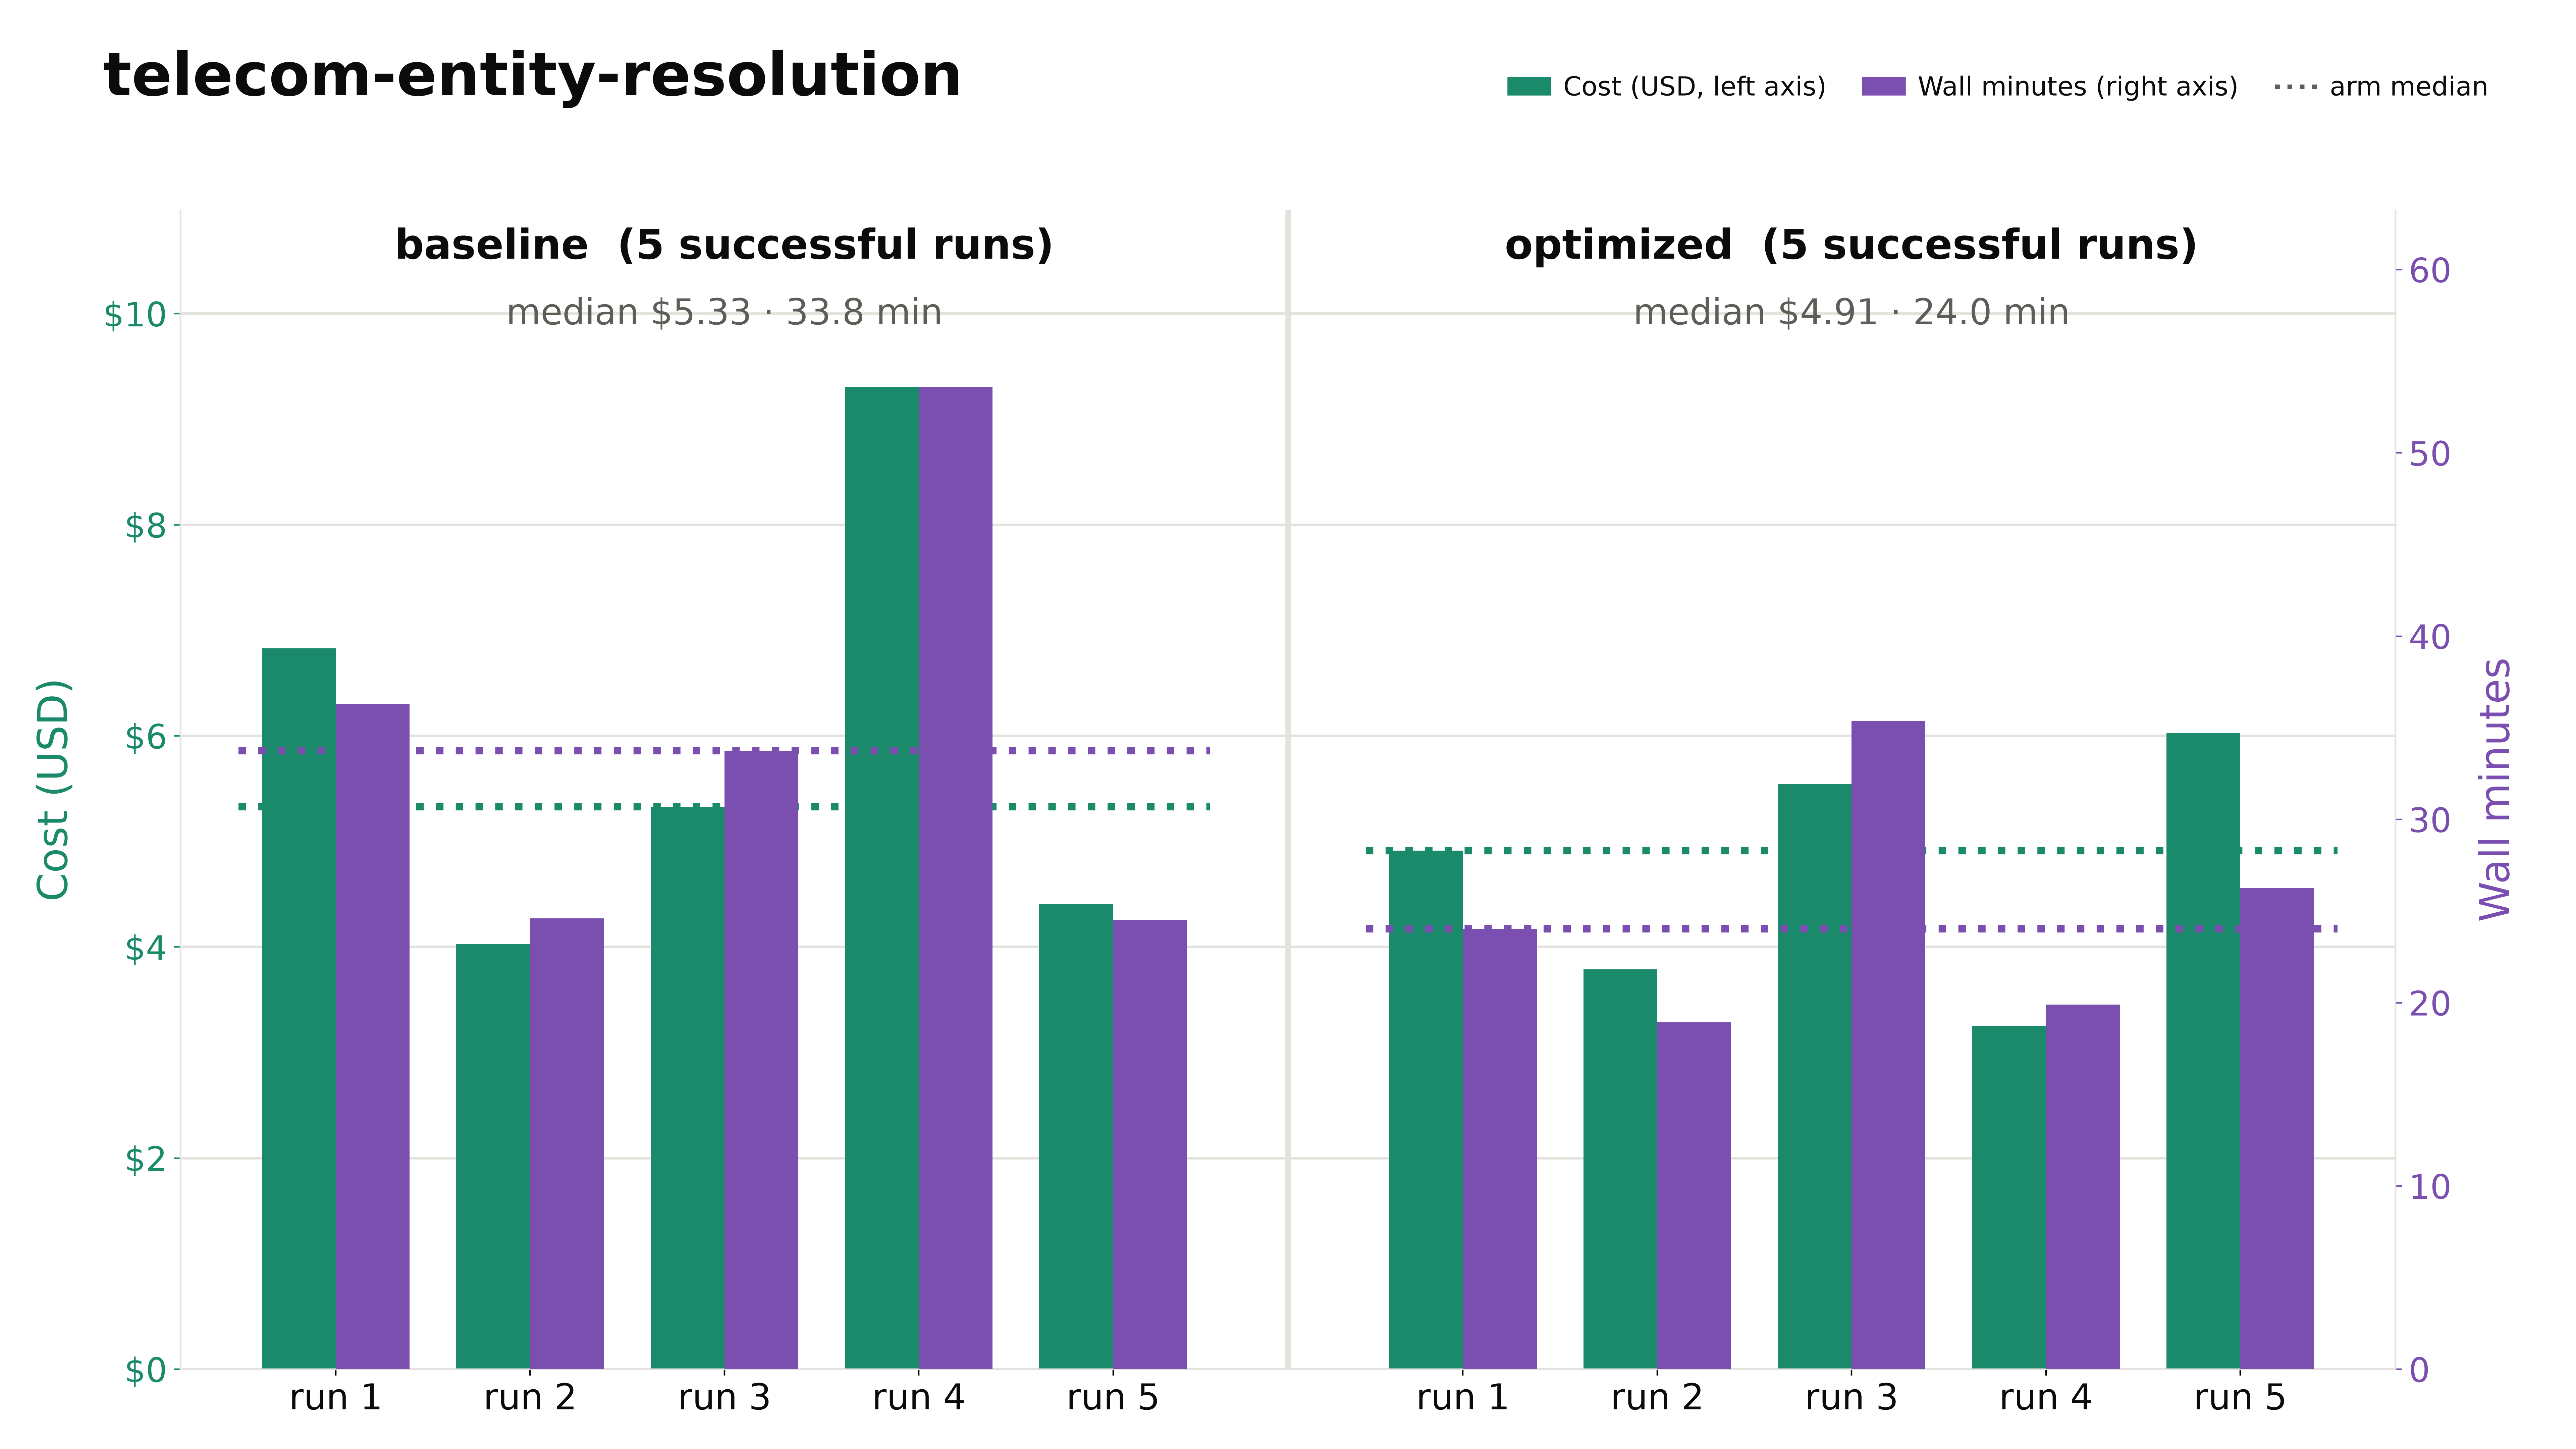
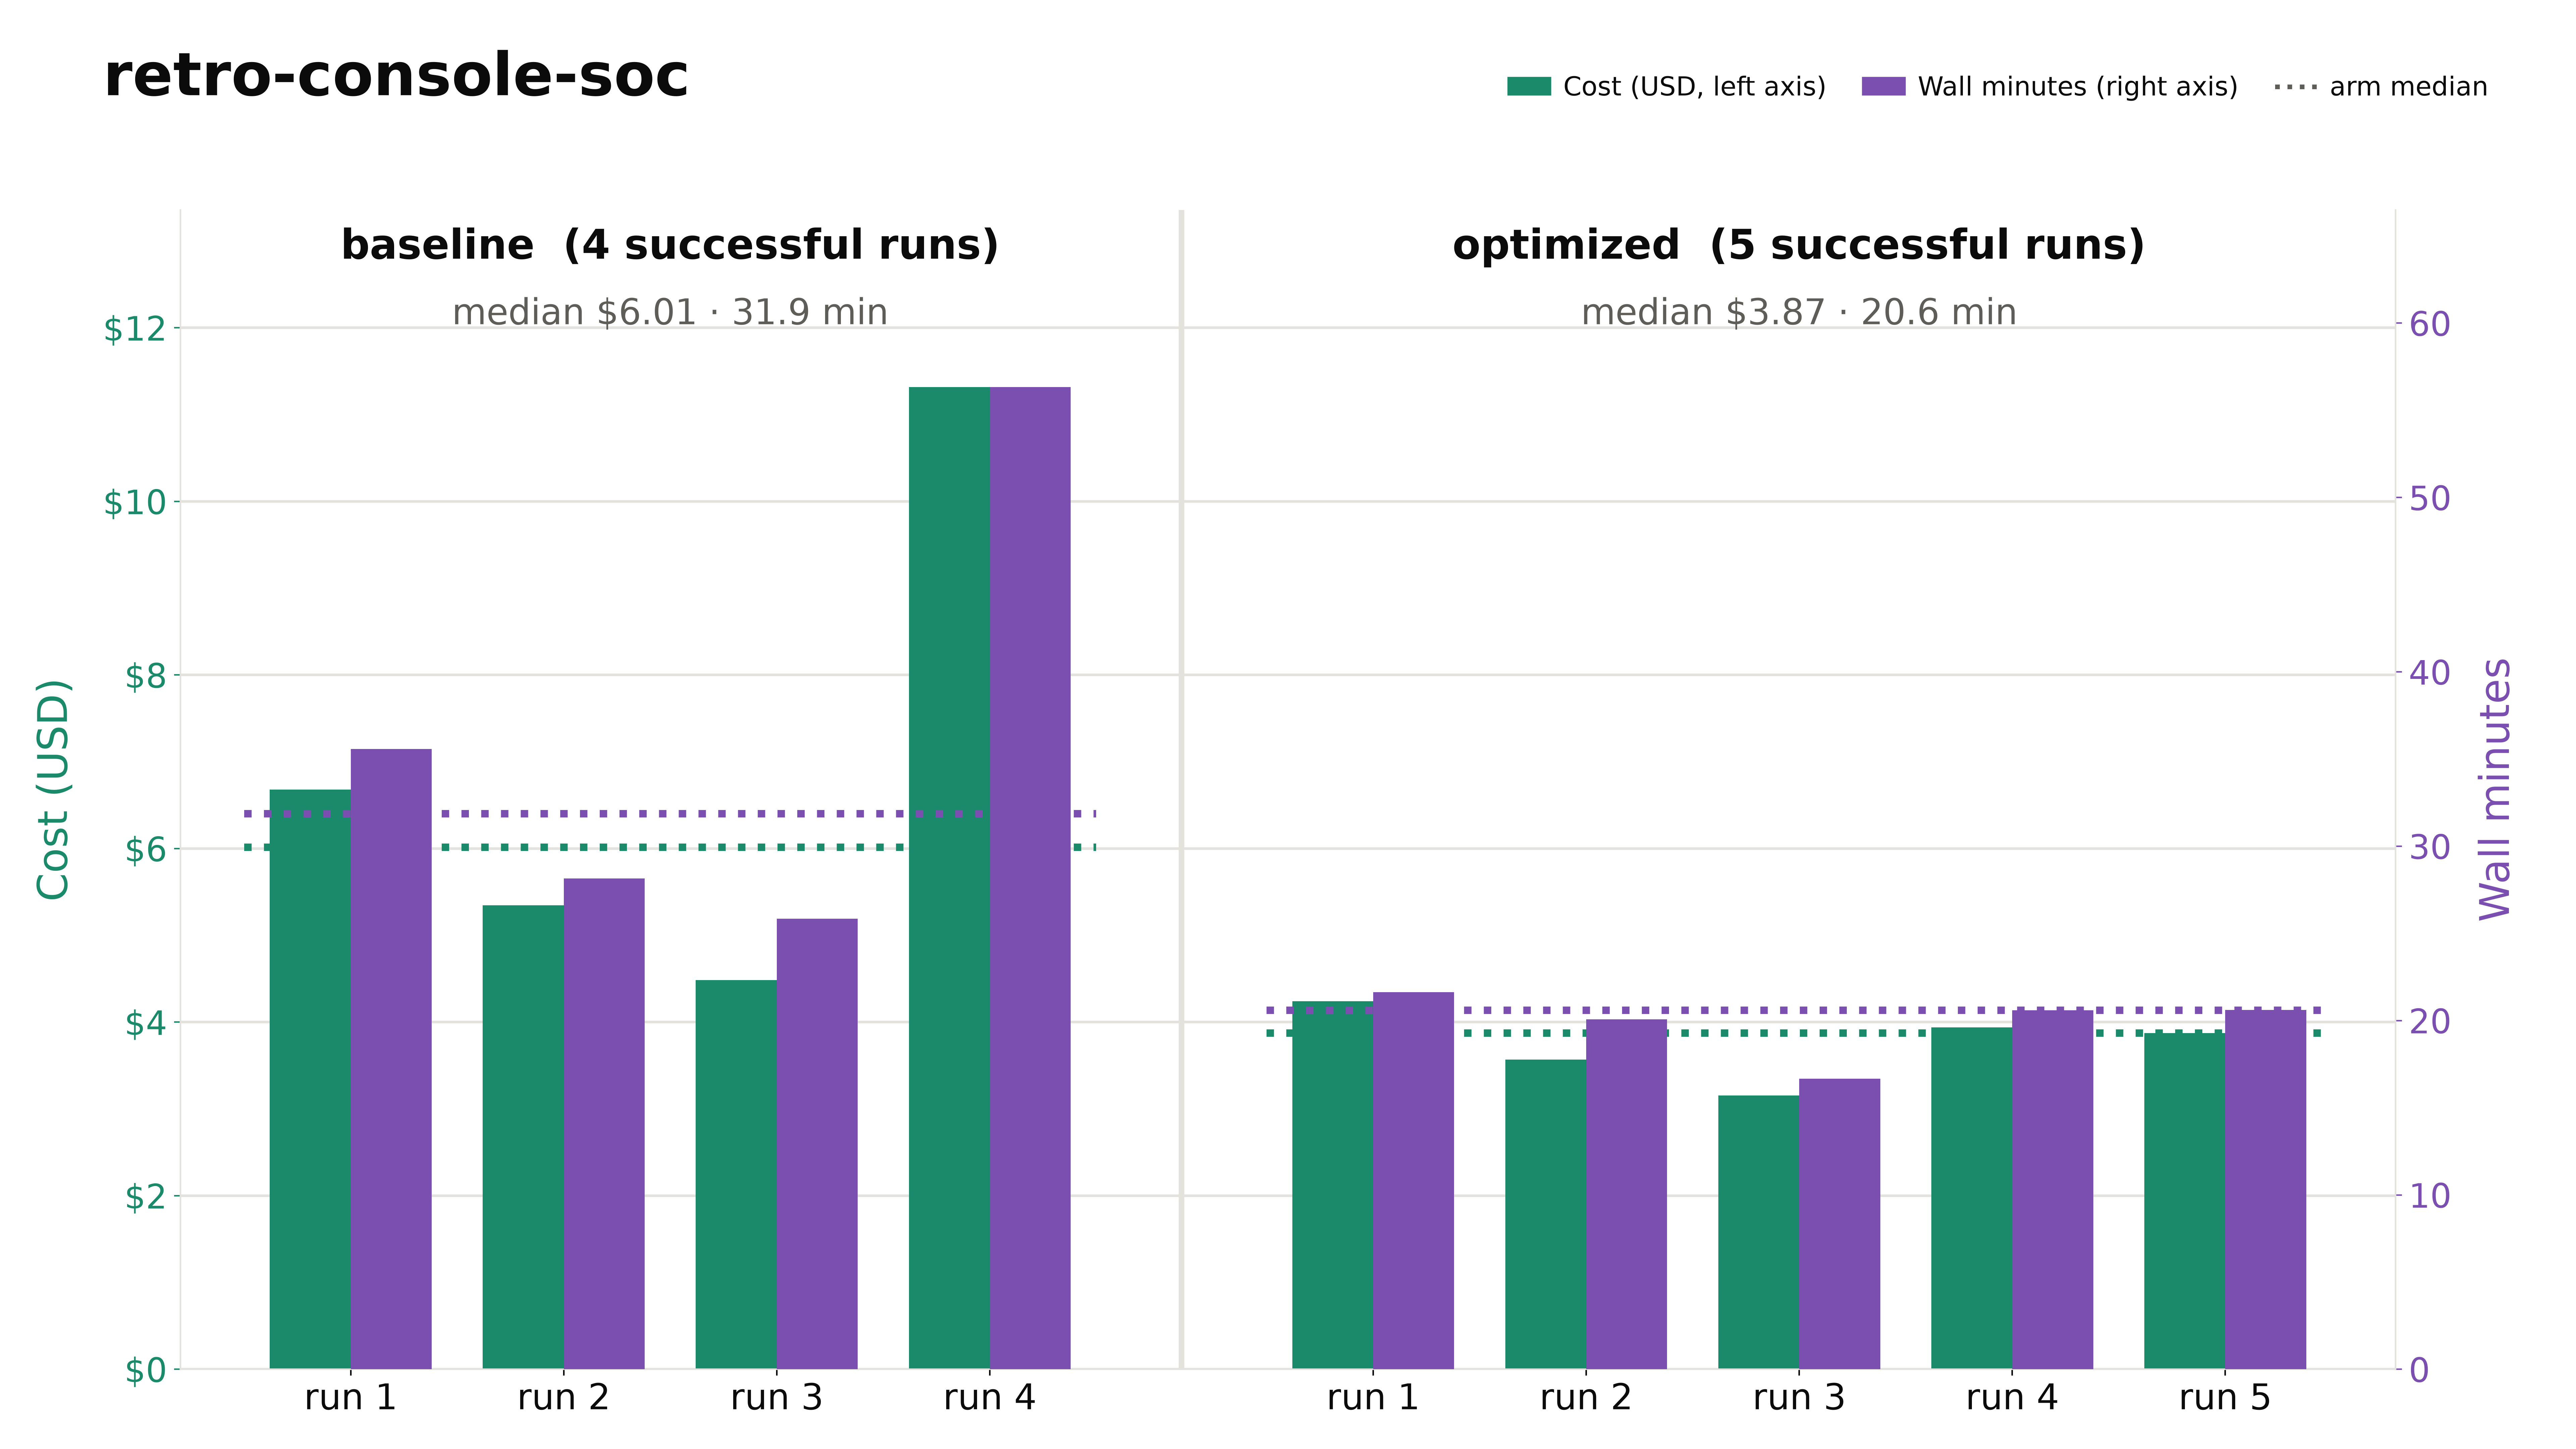
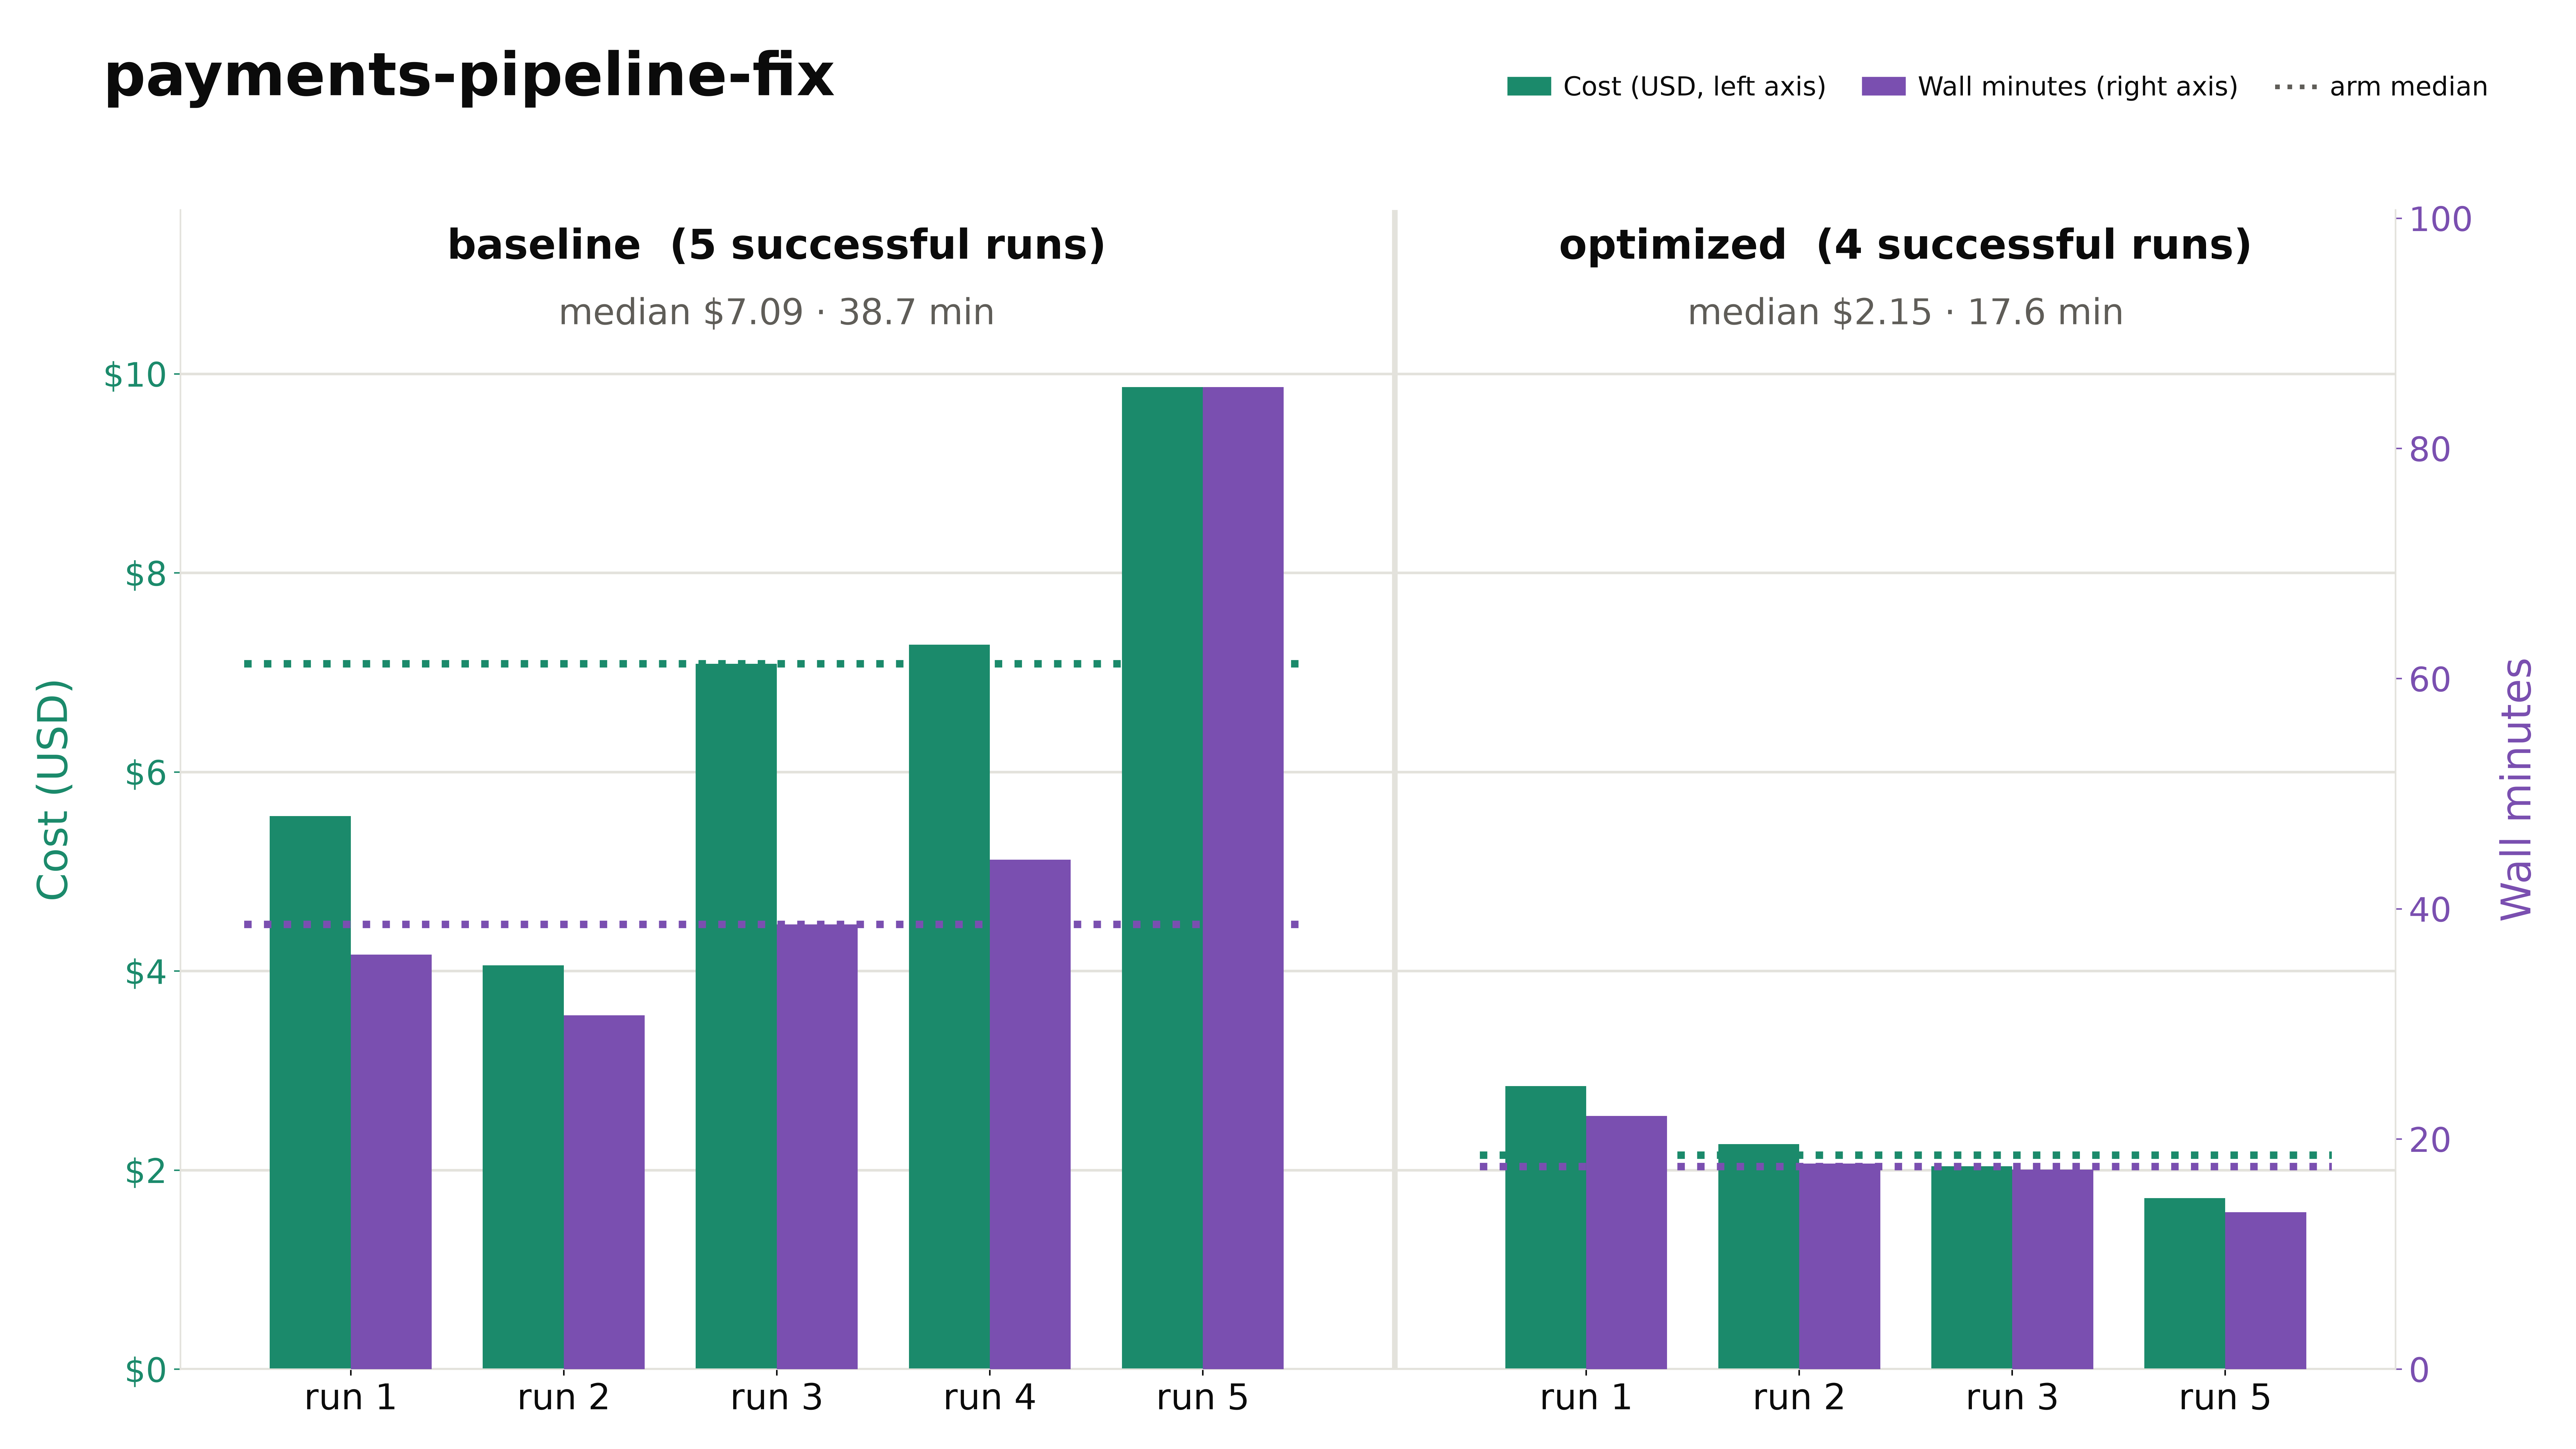
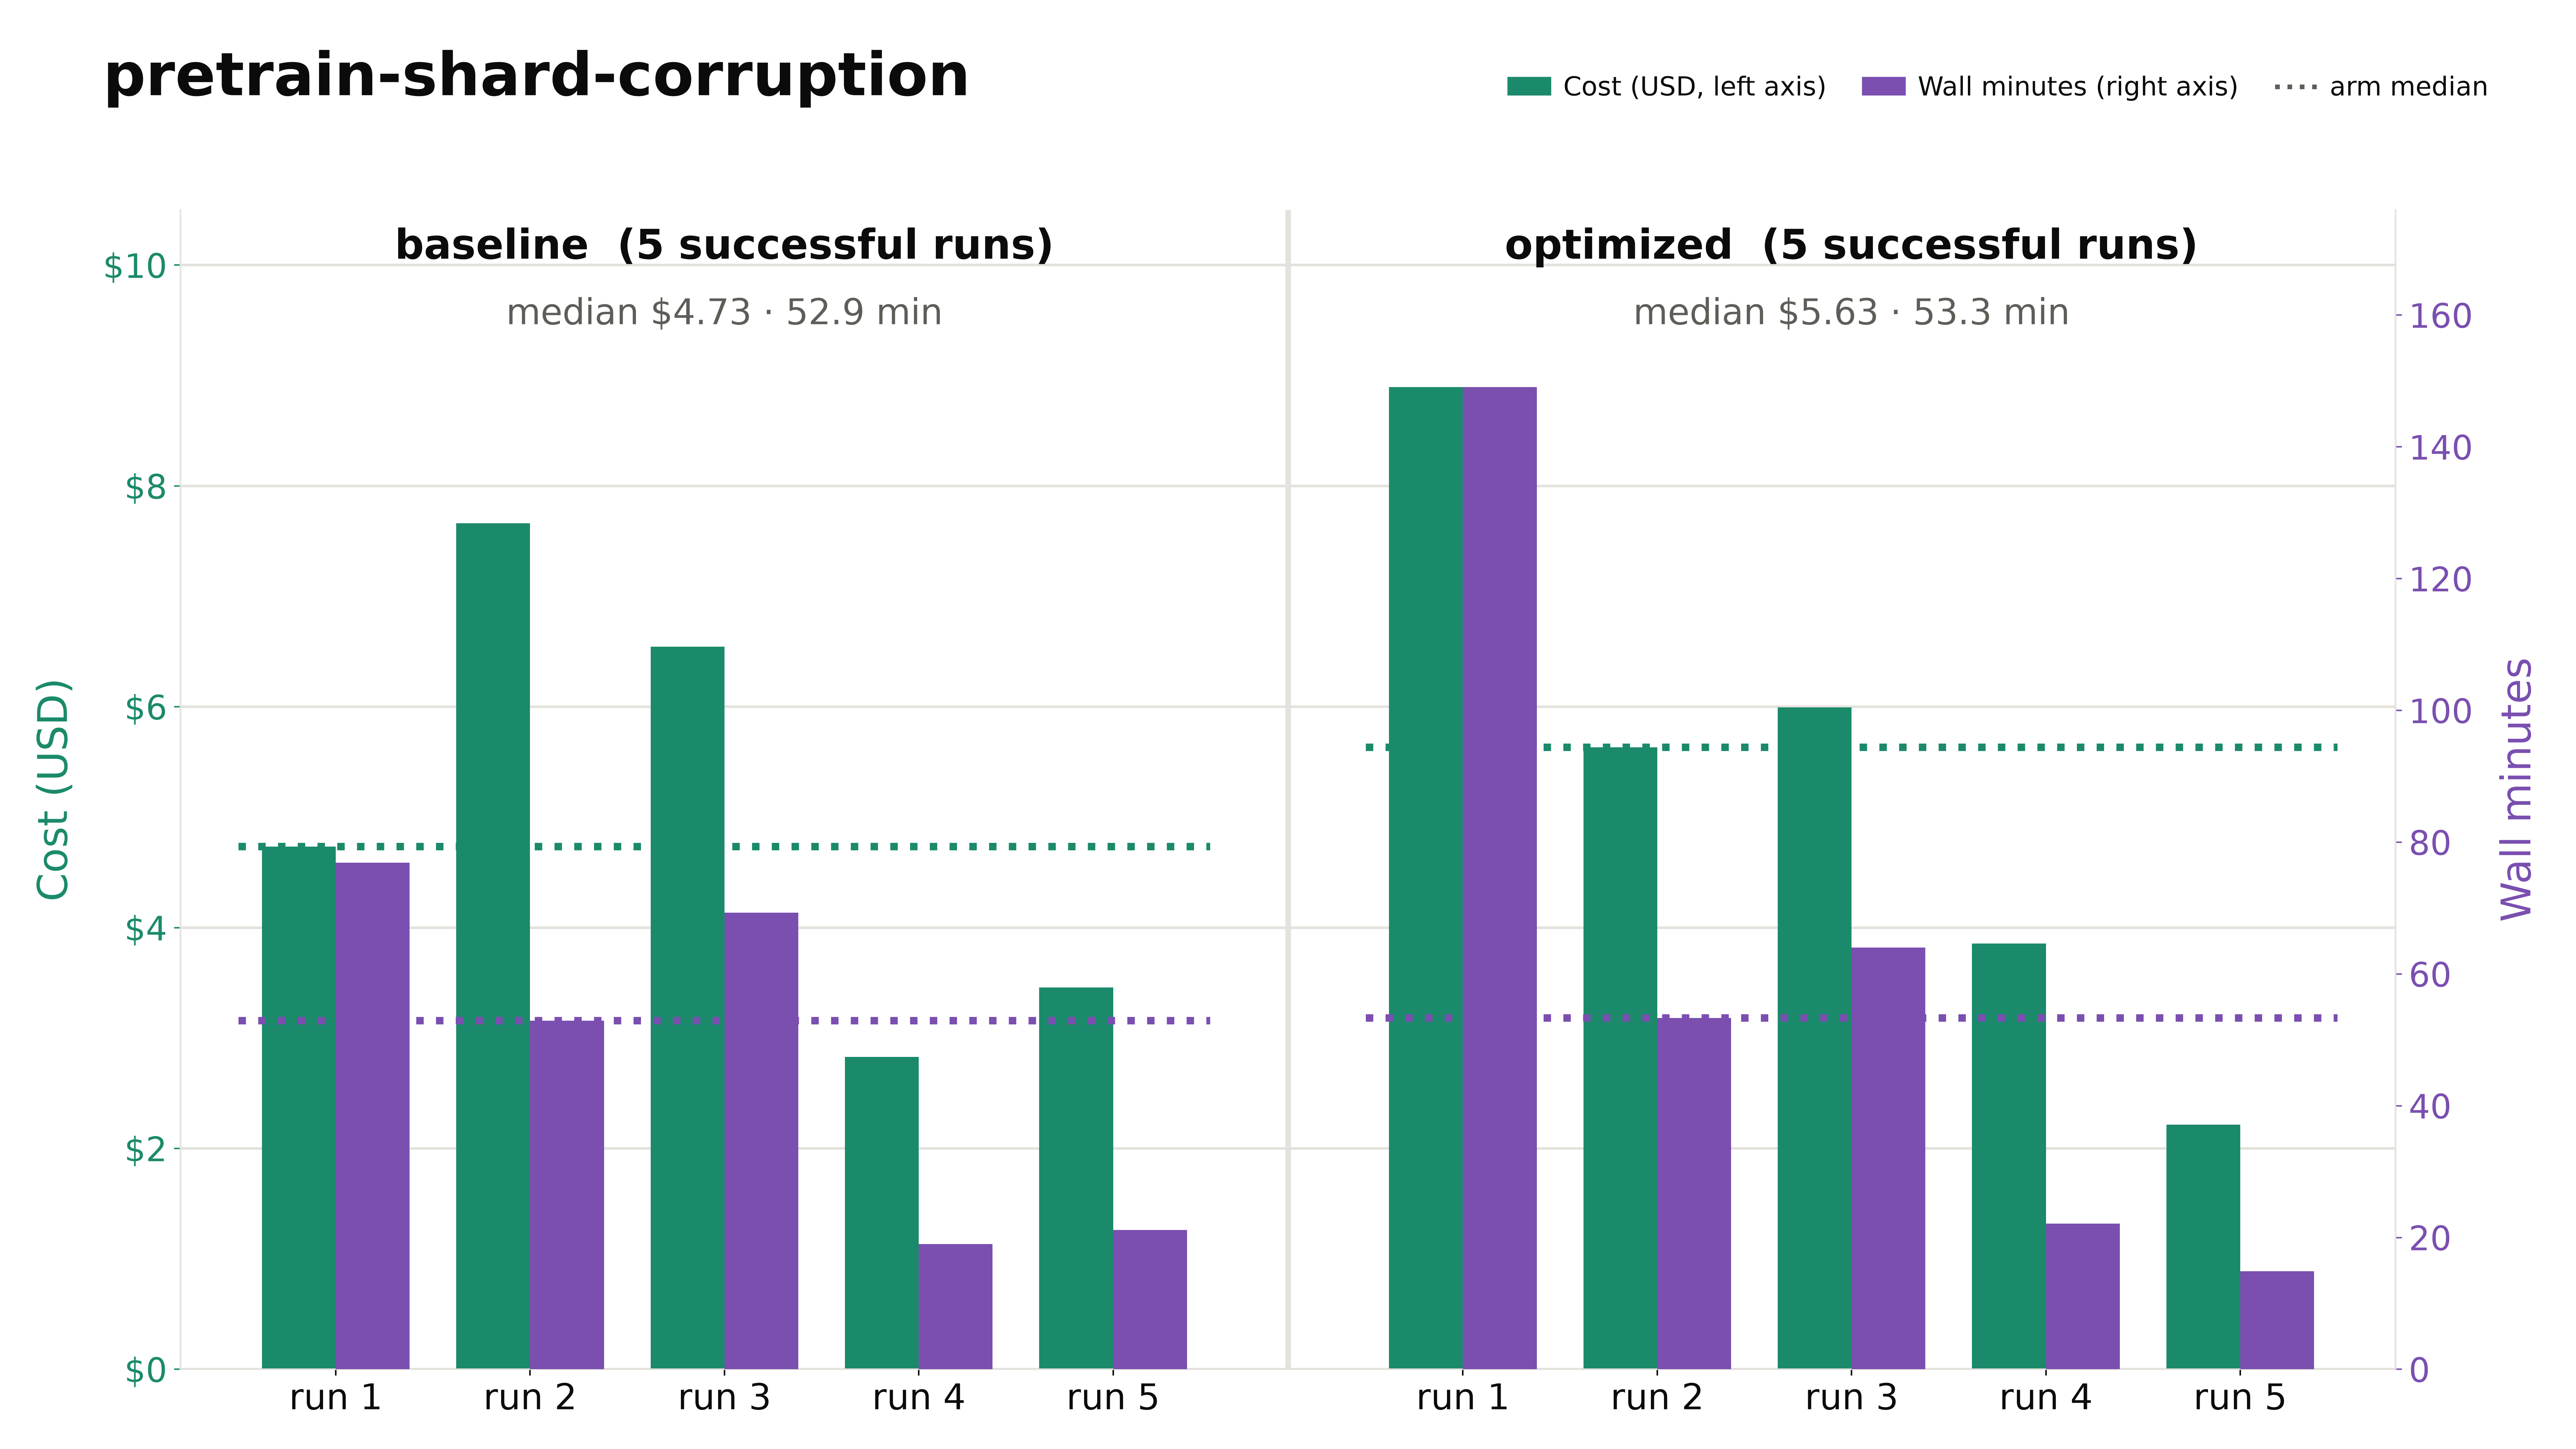
Click on a plot to zoom in.
C. Anomalous runs
A run’s value on wall time, model time, cost, input or output tokens is flagged when its robust z-score exceeds 2.5 in magnitude within its task and arm; flagged runs stay in every analysis.
- 39 values are flagged, on 19 of the 97 successful runs (11 baseline, 8 optimized) across 7 of the 10 tasks;
pretrain-shard-corruption,risk-scorer-replayandsound-change-cascadehave none. Five runs are flagged on three or more metrics at once, since time, tokens and cost tend to move together. - Most flagged values are modest: 23 of 39 lie within ±35% of their arm’s median. A large z-score often reflects how tightly the other runs cluster rather than an extreme value; the largest, z = −12.7 for output on
layout-config-recreation2(optimized, run 5), is only 24% below its arm’s median. The biggest departures are baseline runs:embedding-drift-monitorrun 2 took 3.1 times its arm’s median wall time (11.8 vs 3.8 minutes), andpayments-pipeline-fixrun 5 took 2.2 times (85 vs 39 minutes). - The flags lean in the direction of the effect: baseline flags are mostly unusually high values (12 of 19), and optimized flags mostly unusually low ones (14 of 20). Dropping all 19 flagged runs narrows the gap only slightly: the cost effect moves from −20.9% to −18.9%, wall time from −24.0% to −21.6%, and no driver elasticity changes by more than 0.05.
D. A stop hook that runs the real check
The directive that tells the agent to stop once one check passes leaves the choice of check to the agent, and both optimized failures stopped after a weak self-check: a mock test instead of the real Kafka pipeline, and a render that scored 97.99% against a 98% bar. A stop hook moves the choice of check into the harness.
- [When it runs] Claude Code runs the hook, registered under
Stopin.claude/settings.json, every time the agent tries to finish, and passes it the event as JSON. - [What it does] It runs the task’s check where the agent’s commands run. If the check passes, the agent may stop. If it fails, the hook blocks the stop, and Claude receives the reason, with the tail of the check’s output, as its next instruction.
- [Which check] Only one that the task exposes to the agent: its existing tests, a provided reproduction or smoke script, or a health check against the real services. Never the hidden grader, which would leak the benchmark’s answer key.
- [Safeguards] After three blocks in a row, the hook lets the agent stop anyway, so it can never trap the agent. A check that runs longer than 900 seconds is killed.