Optimizing Agentic Execution: From Prose to Harness
TL;DR
- We evaluated on Terminal-Bench 4.0: changing what every request carries and costs, in Claude Code’s harness rather than its prompt, cut cost with no loss in pass rate. But no harness change is local: pruning the tools also removed those for watching and stopping background jobs, yet Claude Code’s own guard kept pointing agents to one of them.
- Restoring those tools kept the saving, and agents used them where polling had been heaviest. But a tool brings a capability, not a habit: the agents still polled during their watches, and the tool’s own reply tells them to keep working, not that they may stop and be woken.
- No failure was traced to the harness: in most, the agent’s own checks passed where the benchmark’s tests failed, and in a few, it kept an answer despite seeing evidence against it. Hollow self-checks are where logging and observability come in.
- Validate the analysis, too: we used Claude Code to analyze the runs, and several of its findings changed once checked against the raw events or the benchmark’s grading. A finding is a hypothesis until it is checked.
The previous post tested six compiler-inspired directives placed in Claude Code’s CLAUDE.md: batch independent reads, fuse repetitive operations into one script, keep large outputs out of context, edit rather than rewrite whole files, work as a single agent, and stop once one real check passes. With a 12,000-character cap on Bash output, the directives cut cost by 20.9% and wall time by 24.0% across ten Terminal-Bench 4.0 tasks, comparing successful runs. That study, which we call v1, had two limitations:
- [Advice, not enforcement] A directive is prose. The model may or may not follow it on a given step, and nothing in a run records whether it did.
- [One bundle] The six directives and the output cap were tested together.
Prose is only advice. The fix is to move the optimizations into the harness: settings and hooks that Claude Code applies on every request or tool call, whatever the model decides, and purpose-built tools. All of these can log when they act.
Which optimizations are worth moving? Not all of them pay. A tool that enforces a directive adds its definition to every request, and some directives only enforce what the agents already do. To find the ones that pay, we re-priced the requests that baseline Claude Code made in an earlier eval on v1’s ten tasks. Each candidate change was priced at list prices, as if it had been in place, with the agent’s behavior held fixed. Four findings shaped v2:
- [Context is re-read] Every request re-reads the whole conversation from the prompt cache. A cached read is cheap, but each request pays for every token again. On Claude Code’s 1-hour cache, its default on a subscription like ours, a token kept for 50 more requests has cost nearly as much as generating it. Like a value held in a register, a token costs more the longer it stays.
- [A fixed overhead] The 30K-token system prompt, three quarters of it the tools, skills and plugins that v2 pruned, is part of every request.
- [The model fills the context] The model’s own output, not tool output, makes up most of what enters the context.
- [Changing behavior paid little] Merging an
Editcall and theBashcall that tests it (sed -i … && pytest) saves a request. The merge, though, was worth at most 2.7%, as the agents already fused most edits in the shell.
So what pays reliably is changing what every request carries and costs, whatever the model does. v2 builds the harness on that principle: change the execution environment, not the model. The execution environment is what surrounds the model on every request: the system prompt and tool definitions that the request carries, and the prompt cache that prices the request. v2 makes three changes, each priced first this way:
| v2 change | Why? |
|---|---|
Tools pruned to Bash, Read, Edit, Write and Agent; no MCP servers, plugins or skills | Baseline offers 39 tools; in its 48 successful runs in the earlier eval, agents called 11, and Bash made 93% of the calls. The first request shrinks from about 31K tokens to 7.4K. |
| Prompt-cache lifetime chosen per task, 5 minutes or 1 hour, from earlier runs’ profiles | A 1-hour cache write costs 60% more, and only tasks with long pauses between requests gain from it. |
| Subagents allowed again, general-purpose only (the one type the runs used) | A subagent’s exploration stays out of its parent’s context. |
We ran baseline Claude Code against v2 on two sets of tasks. The first is v1’s ten tasks, the same task set as v1, which we call the tuning tasks, as v2 was designed from runs on them. The second is ten held-out tasks that no part of the project had touched, drawn at random within Terminal-Bench’s categories (save for a cache setting changed during the eval; Appendix B.1). Each arm ran five times per task, the two arms alternating, one run at a time: 200 runs on Claude Code 2.1.296 and Opus 5.5 at the default effort. Only v2 ran logging hooks. As in v1, every effect in this post compares successful runs with v1’s estimator (the per-task Hodges-Lehmann shift of logs, averaged over tasks). We compare only on the tasks that each arm passed in at least 3 of its 5 runs, which we call the majority tasks. Every v1 task met this bar, and so did 4 of the held-out tasks. Pass rates count every run on the majority tasks.
- [Cost] Down 15% over all 14 majority tasks (significant), at no cost to the pass rate: 69 of 70 v2 runs passed, against baseline’s 65. The saving comes from smaller and cheaper requests, not fewer. Input fell by a quarter to two fifths, while output, turns and requests showed no significant change. Cheaper cache writes, where v2 chose the 5-minute cache, gave nearly half of the saving. Appendix B.1 tabulates every effect and shows the other two changes at work.
- [Wall time] Up 14% on the tuning tasks, but not as a trade-off for the saving. The rise was in tool time, not model time: v2’s agents ran more, or heavier, computations of their own and waited longer on them. Baseline Claude Code itself ran 18% longer in the v2 eval than in the earlier eval on the same tasks. A 14% rise is within that variation (Appendix B.2).
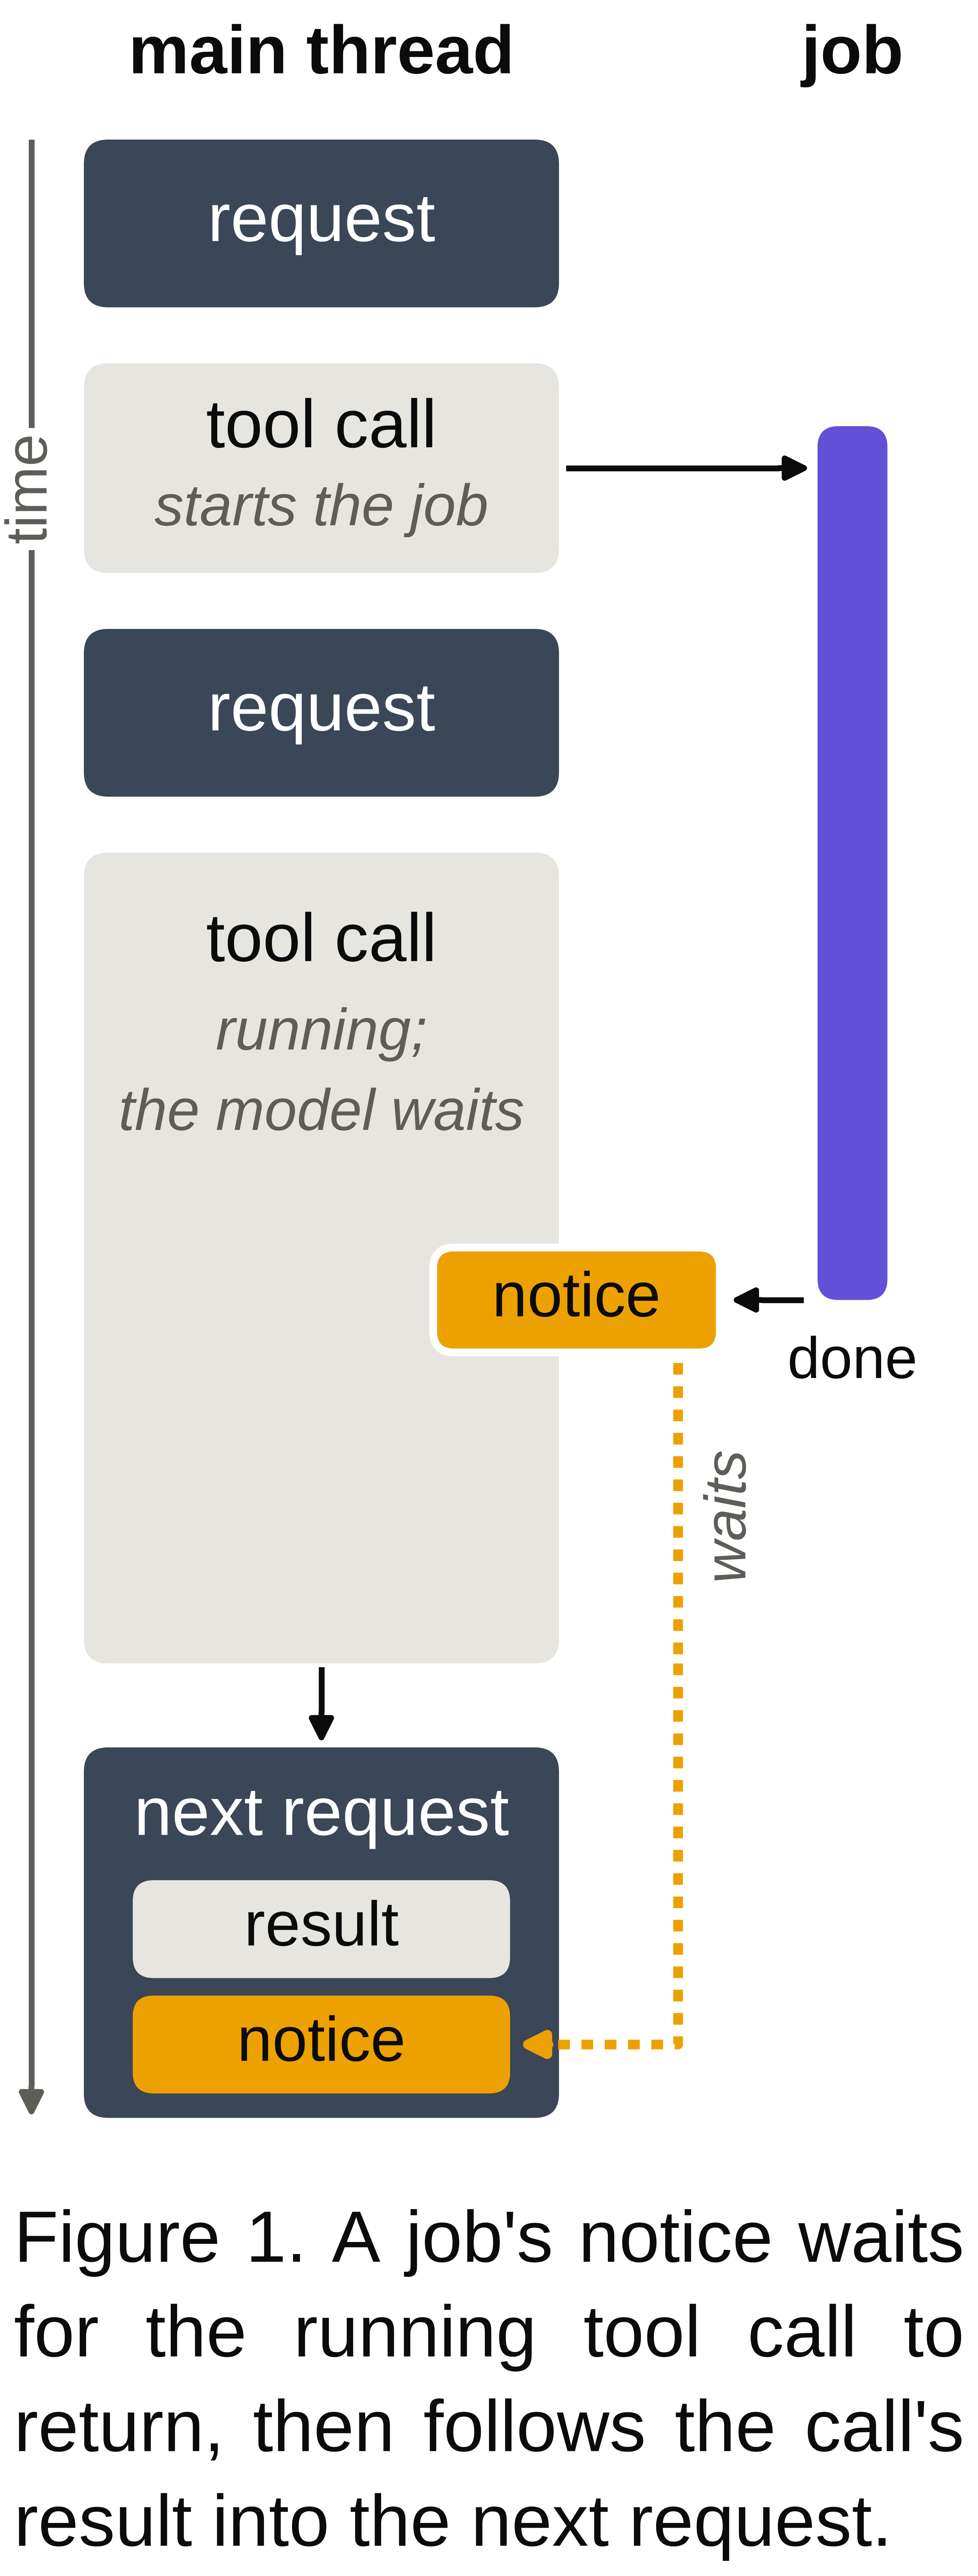
Wall time also depends on how an agent waits for its jobs. Claude Code runs an agent as a loop: a request to the model, the tool calls the model asks for, then the next request. This loop is the agent’s main thread, and jobs can also run beside it, in the background. A tool call starts such a job, for example a Bash command run with run_in_background, and the loop goes on. Claude Code reports on background jobs with notices, such as a job’s completion. Like a single-threaded event loop, Claude Code delivers notices only between tool calls. A notice that arrives while a call runs is queued until that call returns, and the model sees both in the next request (Figure 1). An agent waiting on a job can also go idle: the agent ends its turn, replying without calling a tool, and the job’s notice wakes it.
A foreground polling loop, such as until grep -q done train.log; do sleep 30; done, is a tool call of its own. The job’s end sends a notice but does not stop that loop, so the main thread stays on the loop until its next check succeeds or the call times out, and only then does the model see the notice. A job’s end and a call’s return coincide only when the agent runs the job itself in the foreground, and then there is no notice: the call’s return is the signal.
Pruning also removed three of Claude Code’s tools (Appendix D):
- [
Monitor] Starts a watch: a shell command run in the background, whose printed lines arrive as notices. - [
TaskStop] Stops a job or a watch. - [
ReadNotifications] Reads a separate queue, of messages such as pull-request activity.
Claude Code, though, still blocks a long sleep with a message that says to “use Monitor with an until-loop”. This sleep guard (Appendix D) pointed v2’s agents to a tool they no longer had. Their most common next move was the until-loop, run in the foreground (Appendix C.2). On the tuning tasks overall, v2’s agents waited less efficiently than baseline’s. Their foreground polling loops held the main thread three times as long: 4.7 against 1.5 minutes per run. While their background jobs ran, v2’s agents also kept working less than half of the time: 47%, against 62% for baseline’s, a gap within noise. Waiting was the part a harness change could fix directly, and the missing tools were the obvious suspect.
Re-introducing the Waiting Tools
To address this, we built v2.1: v2 with the three tools restored, and its configuration otherwise unchanged. The objective: agents should stop polling and keep working on the task while their background jobs run (Figure 1). We ran v2.1 against baseline twice, five runs per arm and task, interleaved, one run at a time. The first comparison used the tuning tasks, where v2’s gaps had shown up: 100 runs, every one of which passed. The second used 20 fresh held-out tasks that no part of the project had run: 200 runs, on 7 majority tasks. v2 ran in neither comparison. So each arm is measured against its own baseline: v2 against the baseline run beside it in the v2 eval, and v2.1 against the baseline run beside it in v2.1’s comparisons.
- [The saving held] The three restored tool definitions add 3.9K tokens to every request, but v2.1 cut cost about as much as v2 did: 12% on the tuning tasks, 18% on the fresh ones and 14.5% over all 17 (significant). Wall time did not change significantly on either set. v2.1’s first request is still 63% smaller than baseline’s. Appendix C.1 tabulates both arms’ effects.
On the tuning tasks (Appendix C.2):
- [The agents used the tools] v2.1’s agents watched their jobs with
Monitorin 10 of their 50 runs, against 5 for baseline’s agents. After 6 of their 13 sleep-guard blocks, their next move wasMonitor, as the guard’s message says. v2.1’s agents also calledTaskStop11 times to stop jobs and watches. Their baseline’s agents never did. - [Where v2 polled most, v2.1’s runs were the fastest] Two thirds of v2’s polling was on one task,
pretrain-shard-corruption. There, v2.1’s agents watched their jobs withMonitorand barely polled: a median of one minute per run, against 27 for v2’s agents. v2.1’s runs were also the fastest of any arm’s, at a median of 21 minutes against 37 to 62. With five runs per arm, both gaps are statistically significant against v2, but not against v2.1’s own baseline. - [v2.1’s agents never waited for a notice] v2.1’s agents never ended a turn to be woken by a notice. Baseline’s agents did so in 6 of their 50 runs. And during about half of their
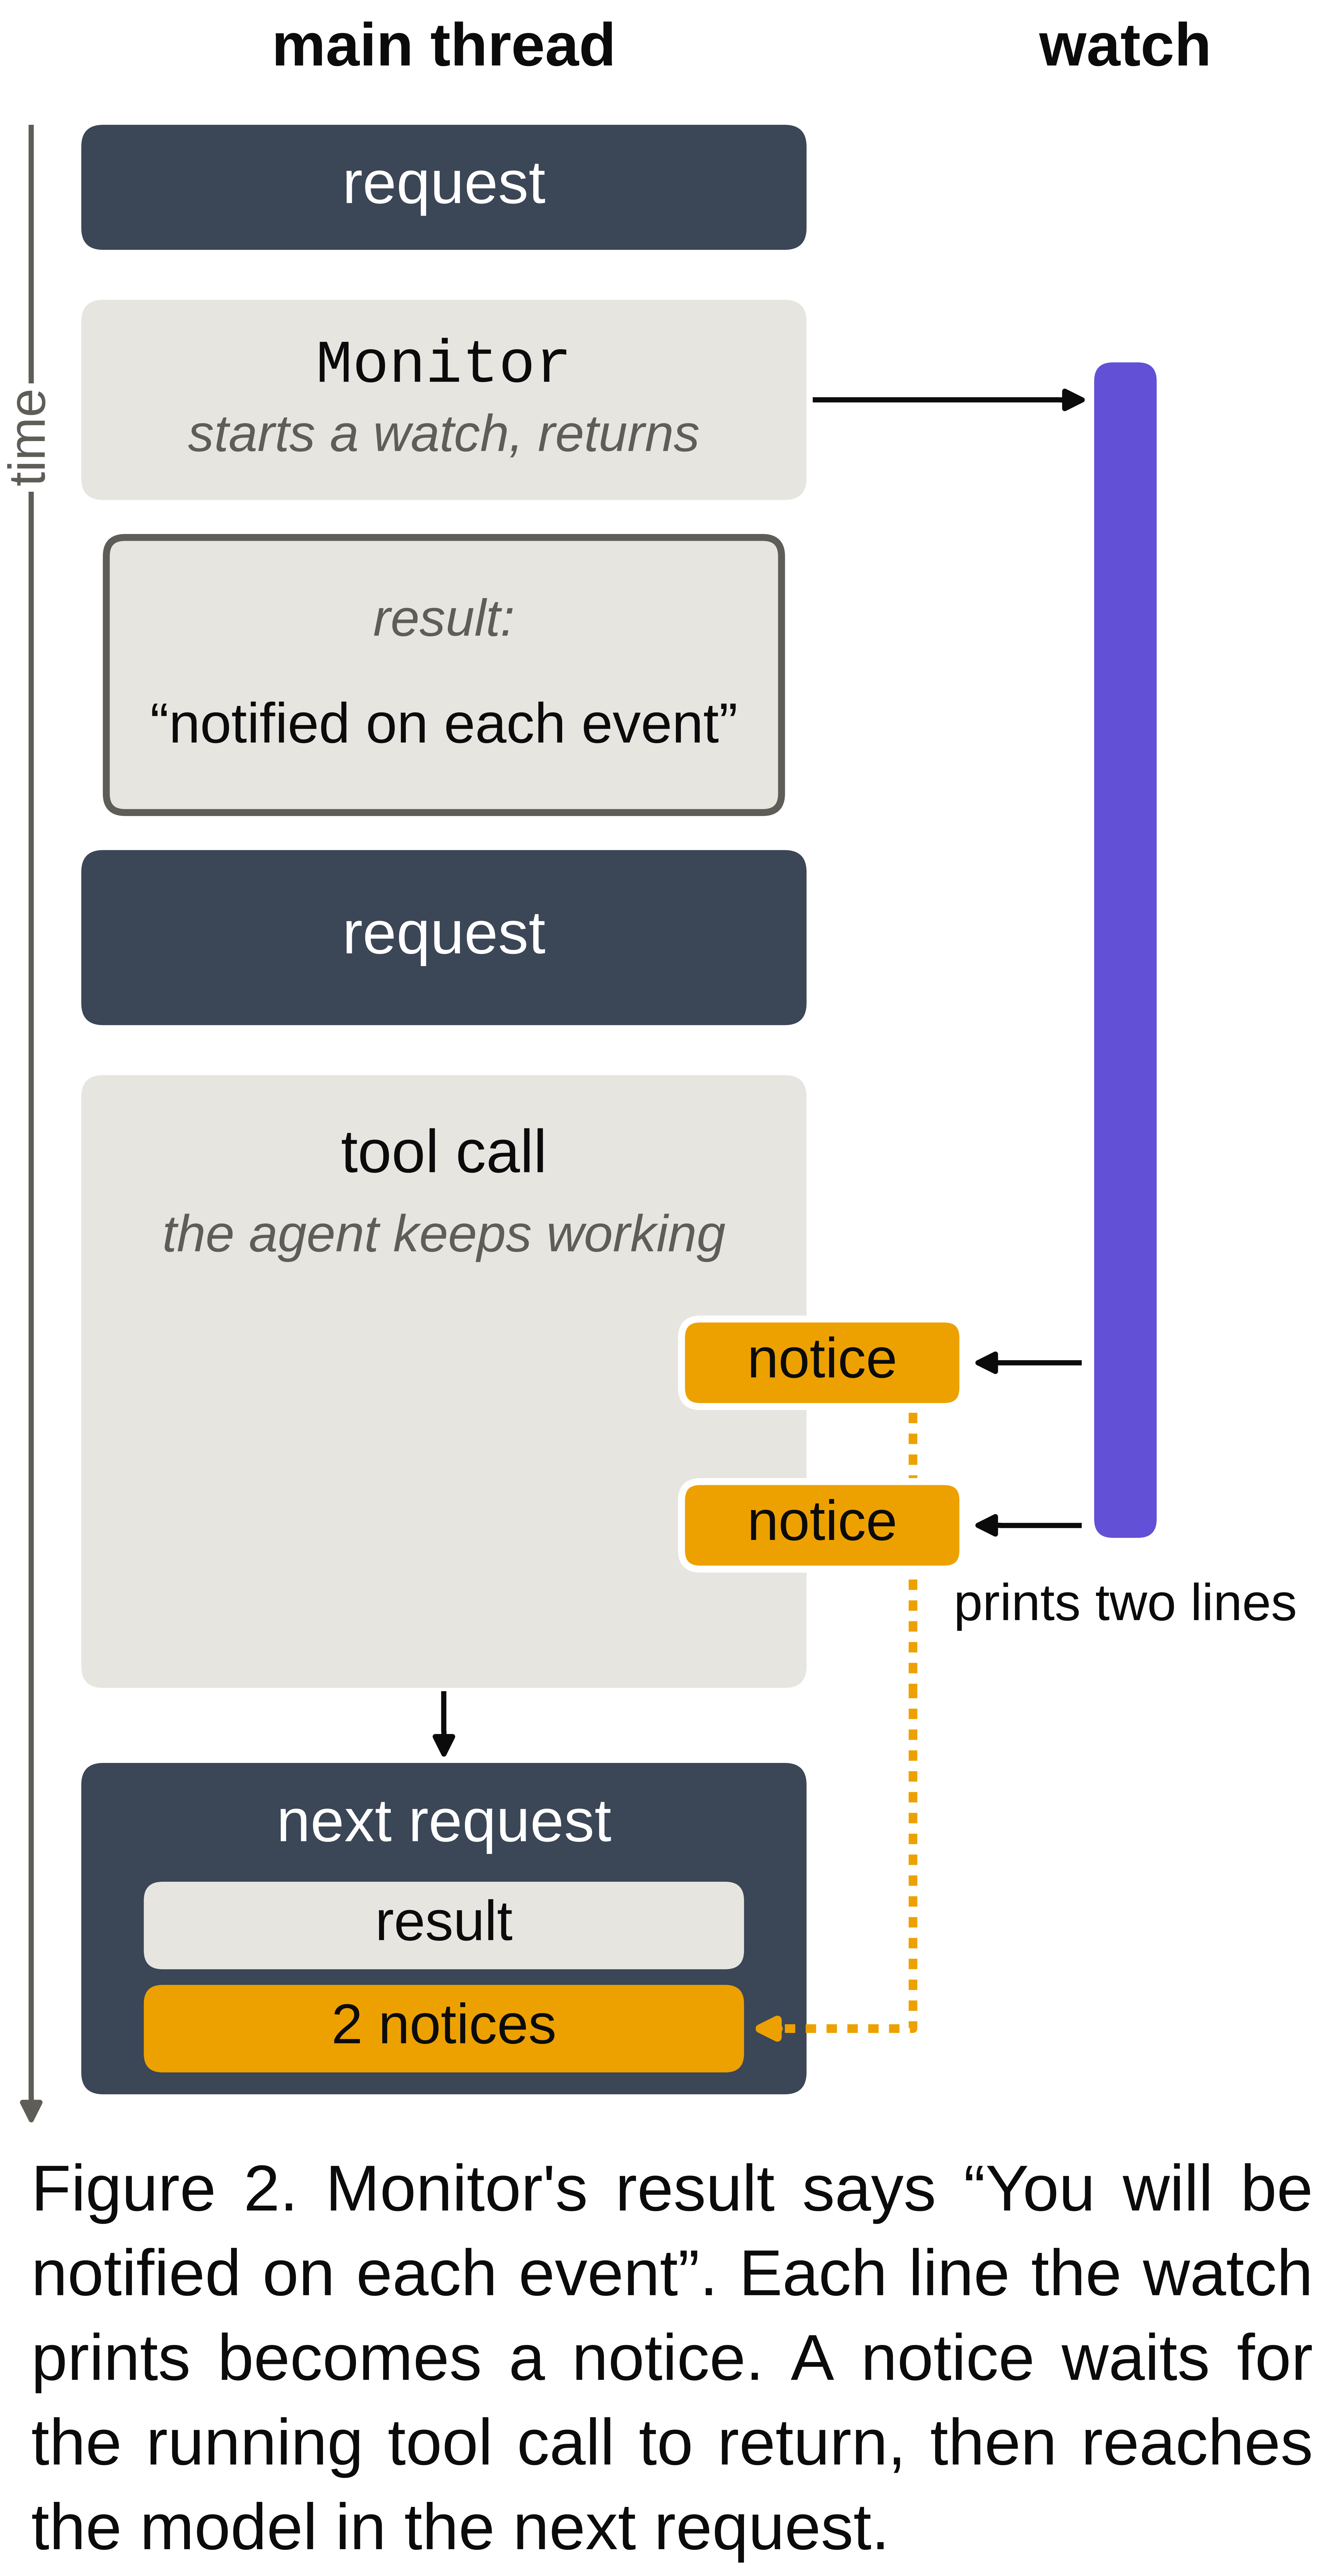
Monitorwatches, v2.1’s agents polled in the foreground anyway. Part of the reason may lie in whatMonitorreturns:Monitor’s result says “You will be notified on each event” (Figure 2).Monitor’s result says “Keep working — do not poll or sleep” (Figure 3).Monitor’s result never says that the agent may end its turn and be woken by the notice (Figure 4).
The agents can wait for a notice, though. In a separate probe with one short job, every v2.1 run went idle and was woken by the job’s notice (Appendix C.5). On the tuning tasks, much of the waiting had no notice to wait for. More than half of v2.1’s polling waited on processes that the agents had started with
nohupor&and left running. Claude Code does not track such detached processes, so no notice reports their end (Appendix C.3).
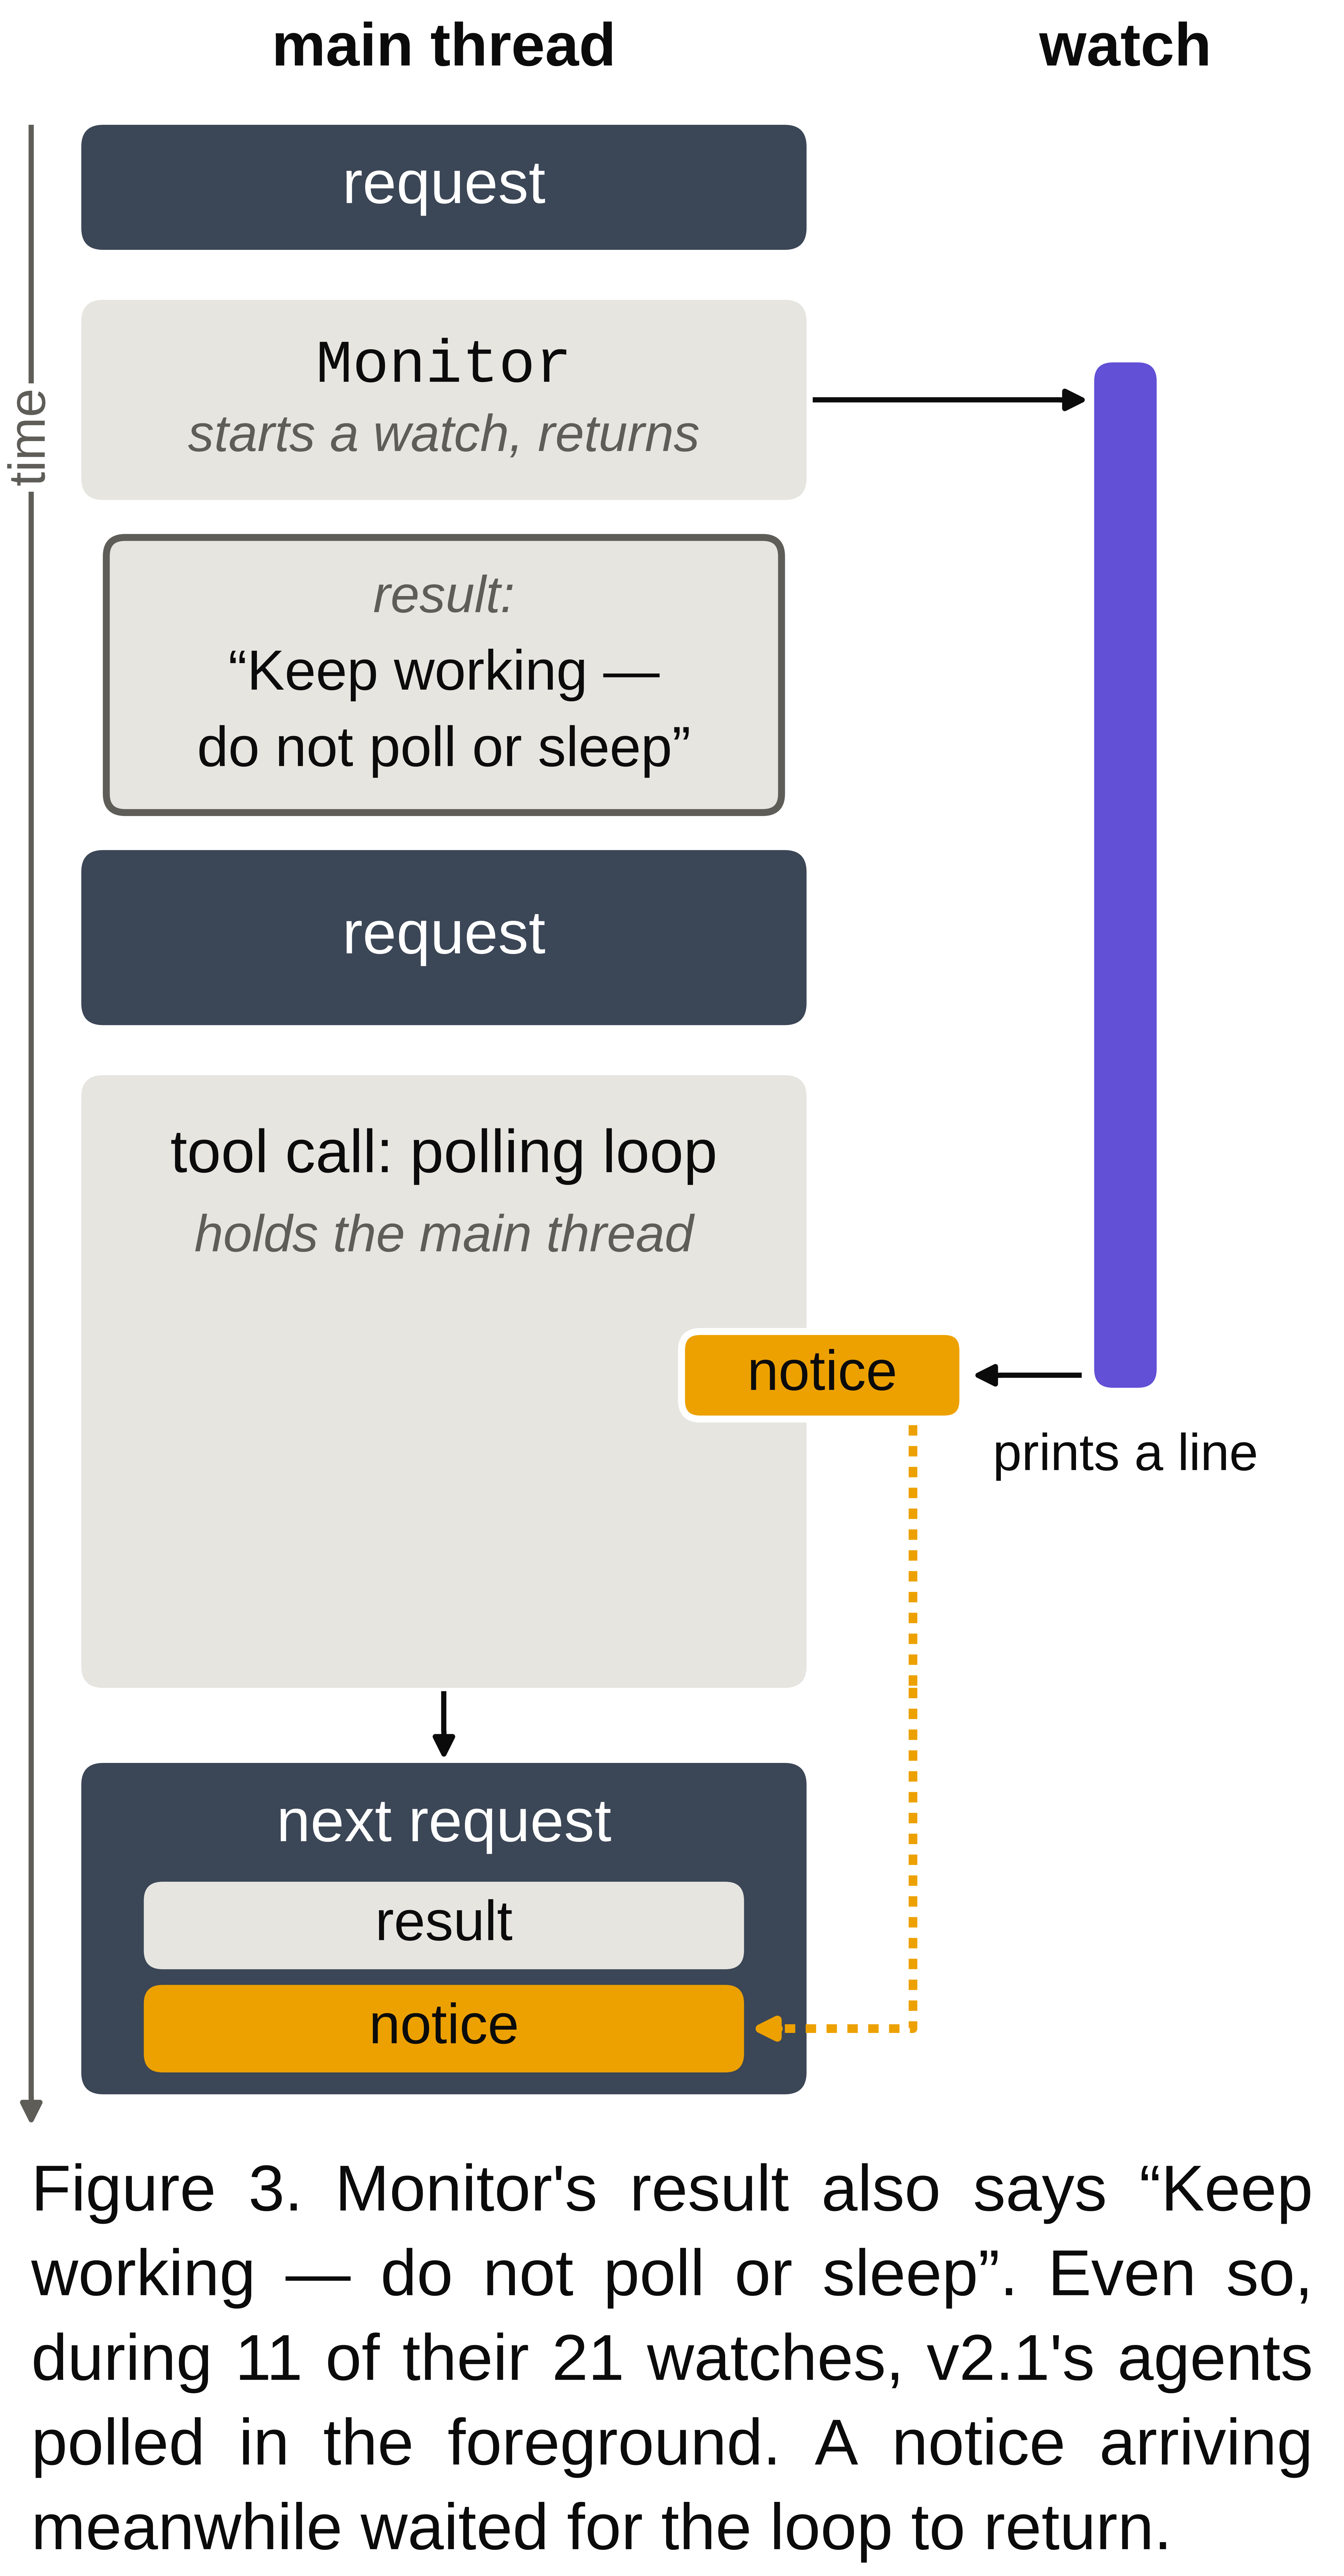
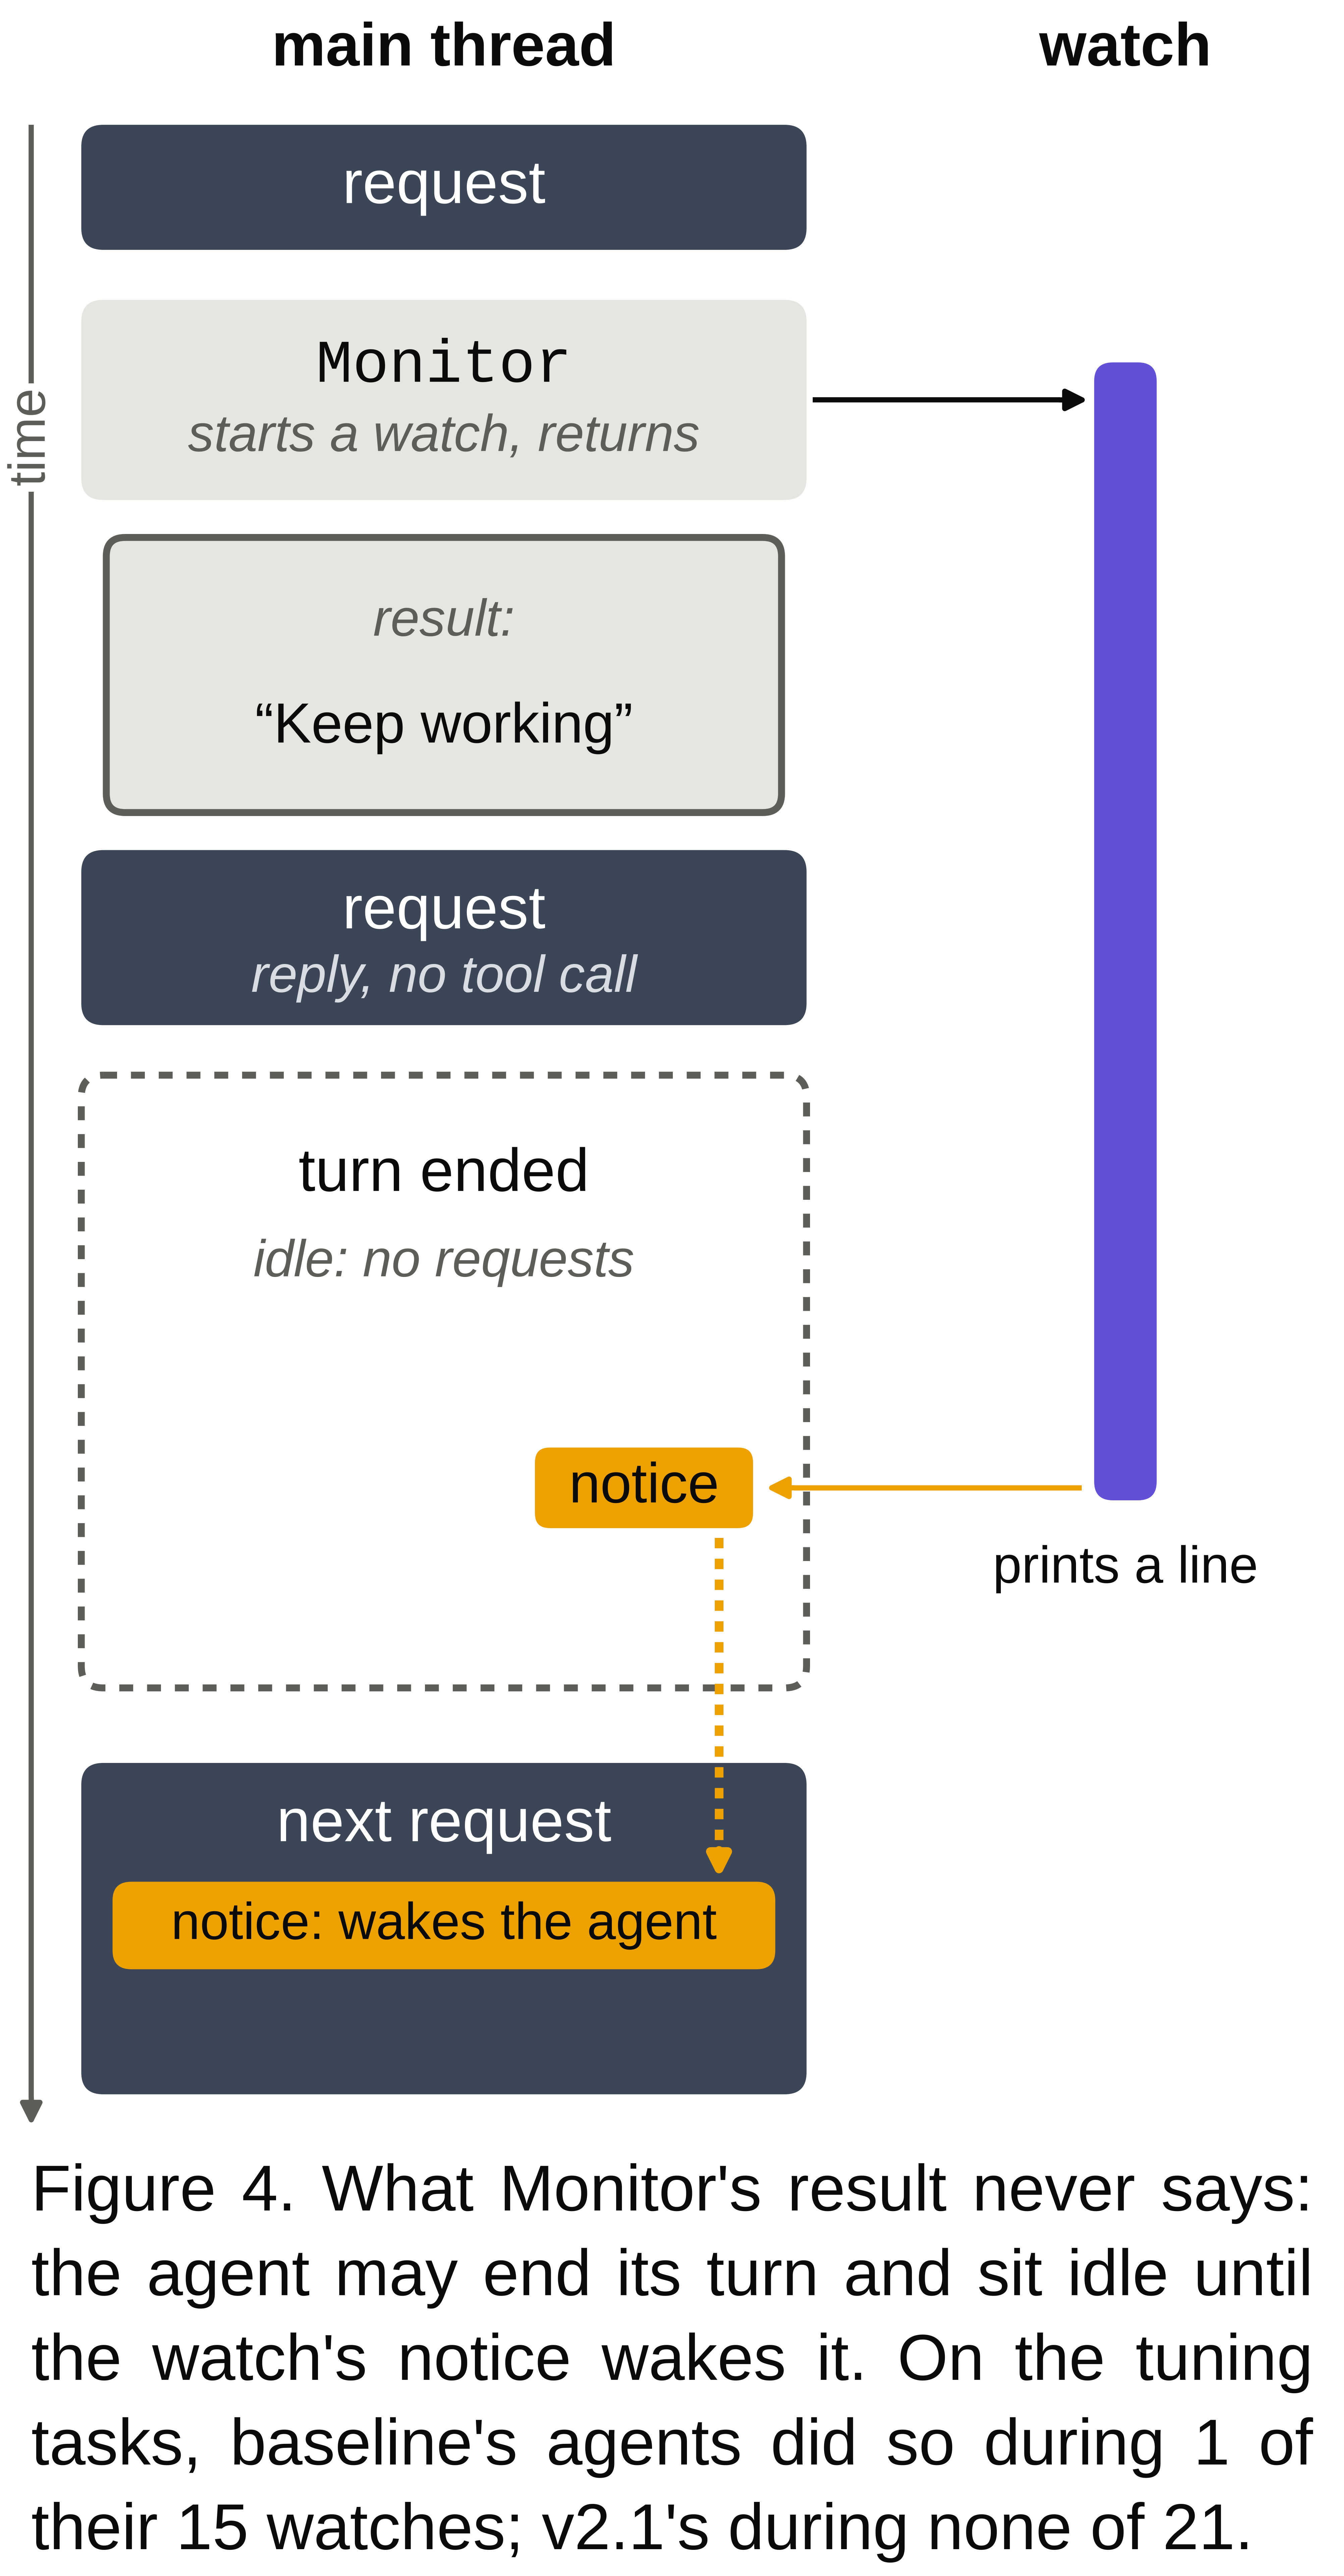
Click on a figure to zoom in.
In short, the restored tools kept v2’s saving, and v2.1’s agents used them. On the task that carried v2’s polling, v2.1’s runs were the fastest of any arm.
Things to Note
On the majority tasks, 12 of the 310 runs failed, 8 of them baseline’s. None was traced to the harness. All but one came down to the agent’s own choices on that run (Appendix E). In eight failed runs, the agent’s own checks passed where the tests failed. For example, one agent cut a CAD part’s slot through both walls instead of one. The agent’s own printout showed the slot removing twice the expected volume, but nothing the agent ran or wrote compared the two.
The eight faults that the agents’ own checks missed are where logging and observability come in. The pattern is not ours alone: one 2026 study of Terminal-Bench 2 failures found verification the largest failure class for four frontier models. Tracing an agent costs bytes, not milliseconds: an OpenTelemetry tracer added 0.1% to agent request latency. But the content an evaluator needs, such as commands, outputs and diffs, is large and sensitive, so the defaults leave it out. Claude Code’s own telemetry, for one, records that a tool ran and whether it succeeded. What the tool ran or printed needs opt-in tool-detail or content logging. Content, though, is where hollow checks show. A monitor that read whole trajectories, reasoning included, caught 95% of test-skipping hacks; one that saw only actions caught 60%. A harness need not log everything to close the gap. It could record each check’s command, exit status and output, and the properties the grader will test. Then a reviewer, or the agent itself, could see what a check could not.
Akin to coding, agents are routinely leveraged for analysis as well. Claude Code “read” the runs’ traces, yet five of its findings, each already reported, changed when checked against the raw events (Appendix F). Each slip drew on too few runs or read a number without asking what else could produce it. For example, with 82 of 200 runs in, v2’s extra time was put down to its agents polling their jobs instead of using Monitor. With all the runs in, most of the extra waiting sat on one task, and the slowdown as a whole was not significant against v2’s own baseline. In a similar vein, the first three tasks examined suggested a rule: no wait on a background job outlasted the job by more than about 20 seconds. On pretrain-shard-corruption, though, one baseline run lost 9.4 minutes to a polling loop that outlived its job.
Just as self-reflection catches errors in coding tasks, self-validation should be built into analysis: a finding is a hypothesis until it has been checked against the raw data.
Closing Thoughts
v1 wrote compiler-inspired optimizations as advice. v2 and v2.1 instead changed the execution environment that every request runs in. Five lessons stand out:
- [Change the environment, not the model] Changing what every request carries and costs paid off: v2 cut cost by 15% at no cost to the pass rate. The saving held, at 14.5%, with three tools restored in v2.1.
- Harness search points the same way: ablations of an evolved coding-agent harness placed its gains in tools, middleware and memory, not in the system prompt (Lin et al.).
- [No harness change is local] Claude Code’s sleep guard (Appendix D) kept pointing v2’s agents to
Monitorafter pruning had removed that tool. Claude Code’s own messages to the agent are part of the harness. Any change to the tools has to be checked against those messages. - [A tool brings a capability, not a habit] With
Monitorback, v2.1’s agents watched long jobs with it. On the tuning tasks, though, none of them ended a turn to be woken by a notice, even though a single short job showed they could. What a tool tells the agent, in its description and its results, may matter as much as what the tool does.Monitor’s notices can wake an idle agent, butMonitor’s result tells the agent to keep working, not that it may end its turn and be woken (Figures 2 to 4). - [A harness can only act on what it sees] On the tuning tasks, most of every arm’s foreground polling waited on detached processes, which send no notice when they end (Appendix C.3). A harness could start such processes as Claude Code’s own background jobs, which do send notices. A harness could also block long foreground polling loops, as Claude Code already blocks long sleeps. And
Monitor’s result could tell the agent that it may end its turn and will be woken. Each change is an experiment of its own, with the pass rate as a guard. - [Validate on both sides of the work] In 26% of failed Terminal-Bench runs, the agent fabricated evidence of success (Zhao et al.). Gating a coding agent’s actions on whether it had gathered enough evidence raised its pass rate by 5 to 12 points (Xu et al.)1. The same check applies to whoever, or whatever, analyzes the runs. Five of Claude Code’s findings changed when checked against the raw events, and a sixth when checked against how the benchmark grades (Appendix F).
Finally, an idea’s incremental lift remains hard to pin down. In one controlled study, the variance in scores due to the harness was 7.8x that due to the model (Zhang et al.). Here, two baseline samples on the same tasks differed by 18% in wall time. Even so, on the task that carried v2’s polling, v2.1 clearly beat v2, though not its own baseline. Across all ten tuning tasks, v2.1 ran 5% faster than v2 when the two are compared directly, and 11% faster when each is measured against its own baseline, neither significantly (Appendix C.2). As the previous post argued, a common reference harness, with a shared protocol for repeats, held-out tasks and reporting cost, would let ideas like these be compared, not just reported.
Notes
- 1 In Xu et al.'s ECLoop, a layer sits between a coding agent and its actions. The layer holds back each code edit and patch submission until the agent's trajectory shows the evidence that the action needs. The conditions come from the issue and the repository. Examples: inspect a function's callers before editing the function; see the failure reproduced before the edit; check the available tests before submitting a patch. A held action goes back to the agent with its unmet conditions. After three holds, the action proceeds, and the unmet conditions stay on record. ↩︎
Appendix A: Per-Task Charts
The tuning tasks, v1’s ten, with baseline against v2.1, five runs per arm, every one of which passed. Left: a Kiviat chart of each arm’s medians on six measures, the four counts scaled so that the larger arm’s value is 100% and the two rates shown as they are, with baseline in blue and v2.1 in green. Right: each run’s cost (top) and wall time (bottom), with the two arms side by side for every run and each arm’s median dotted.
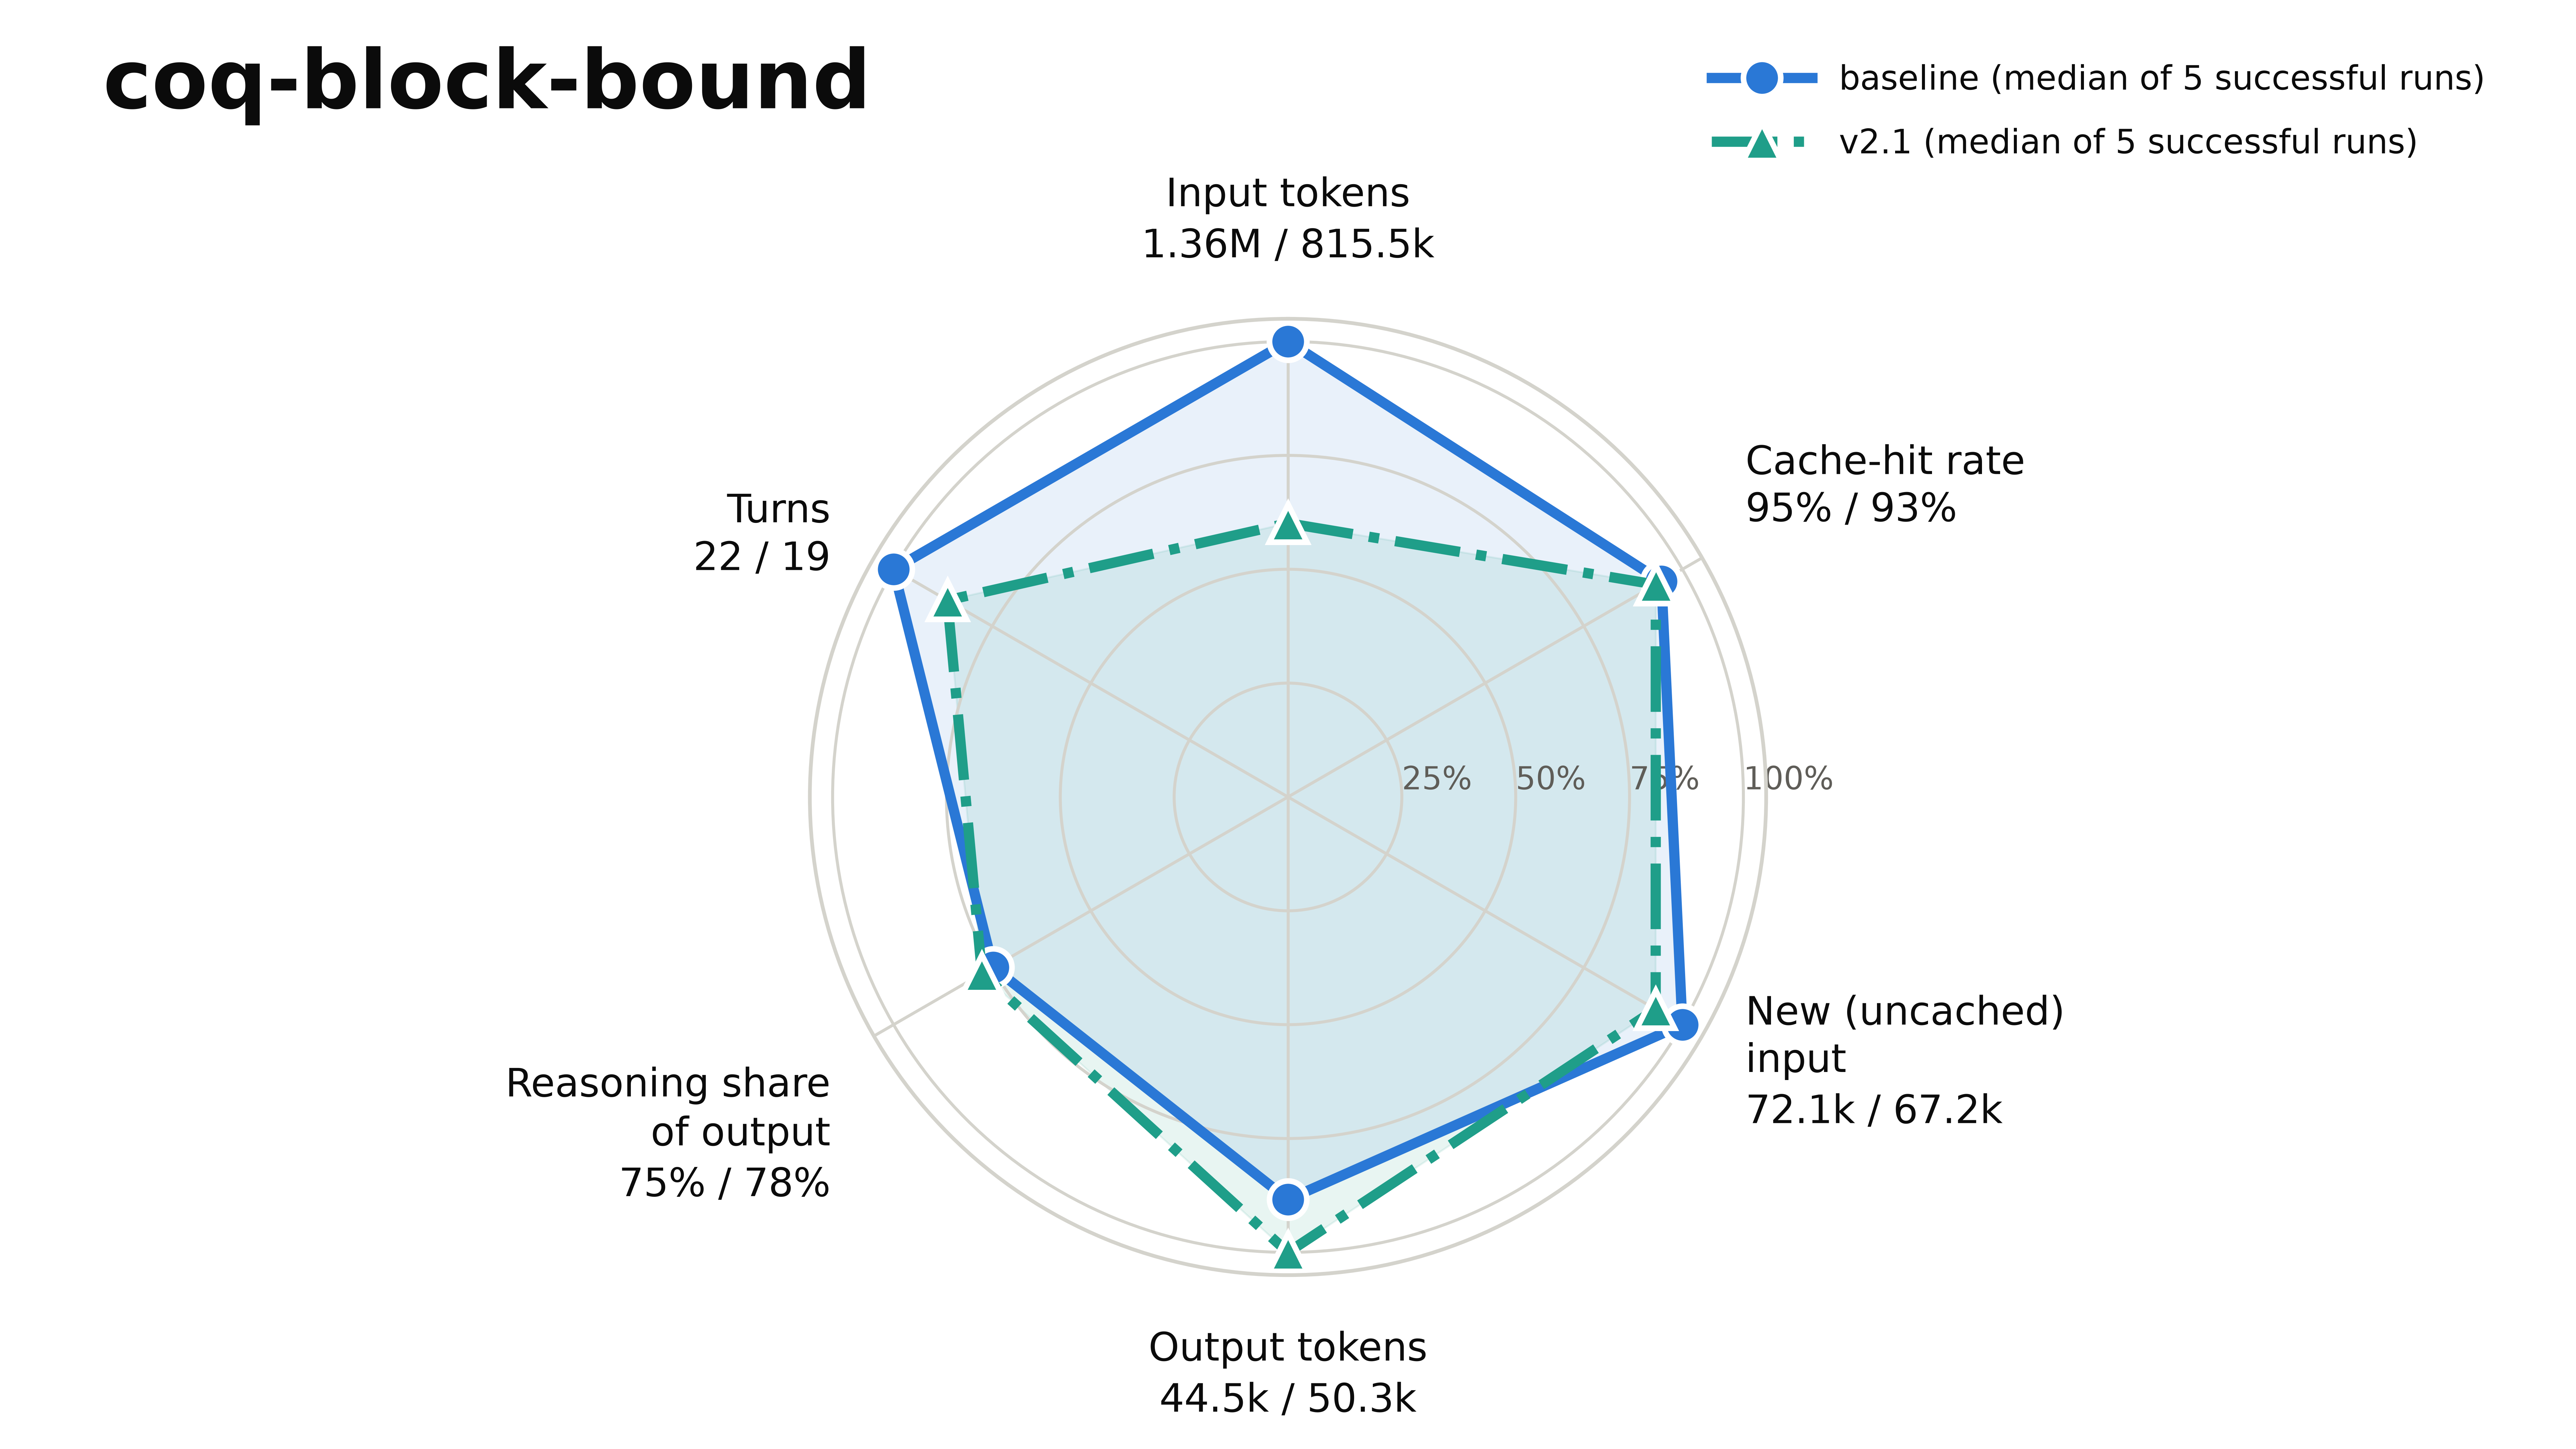
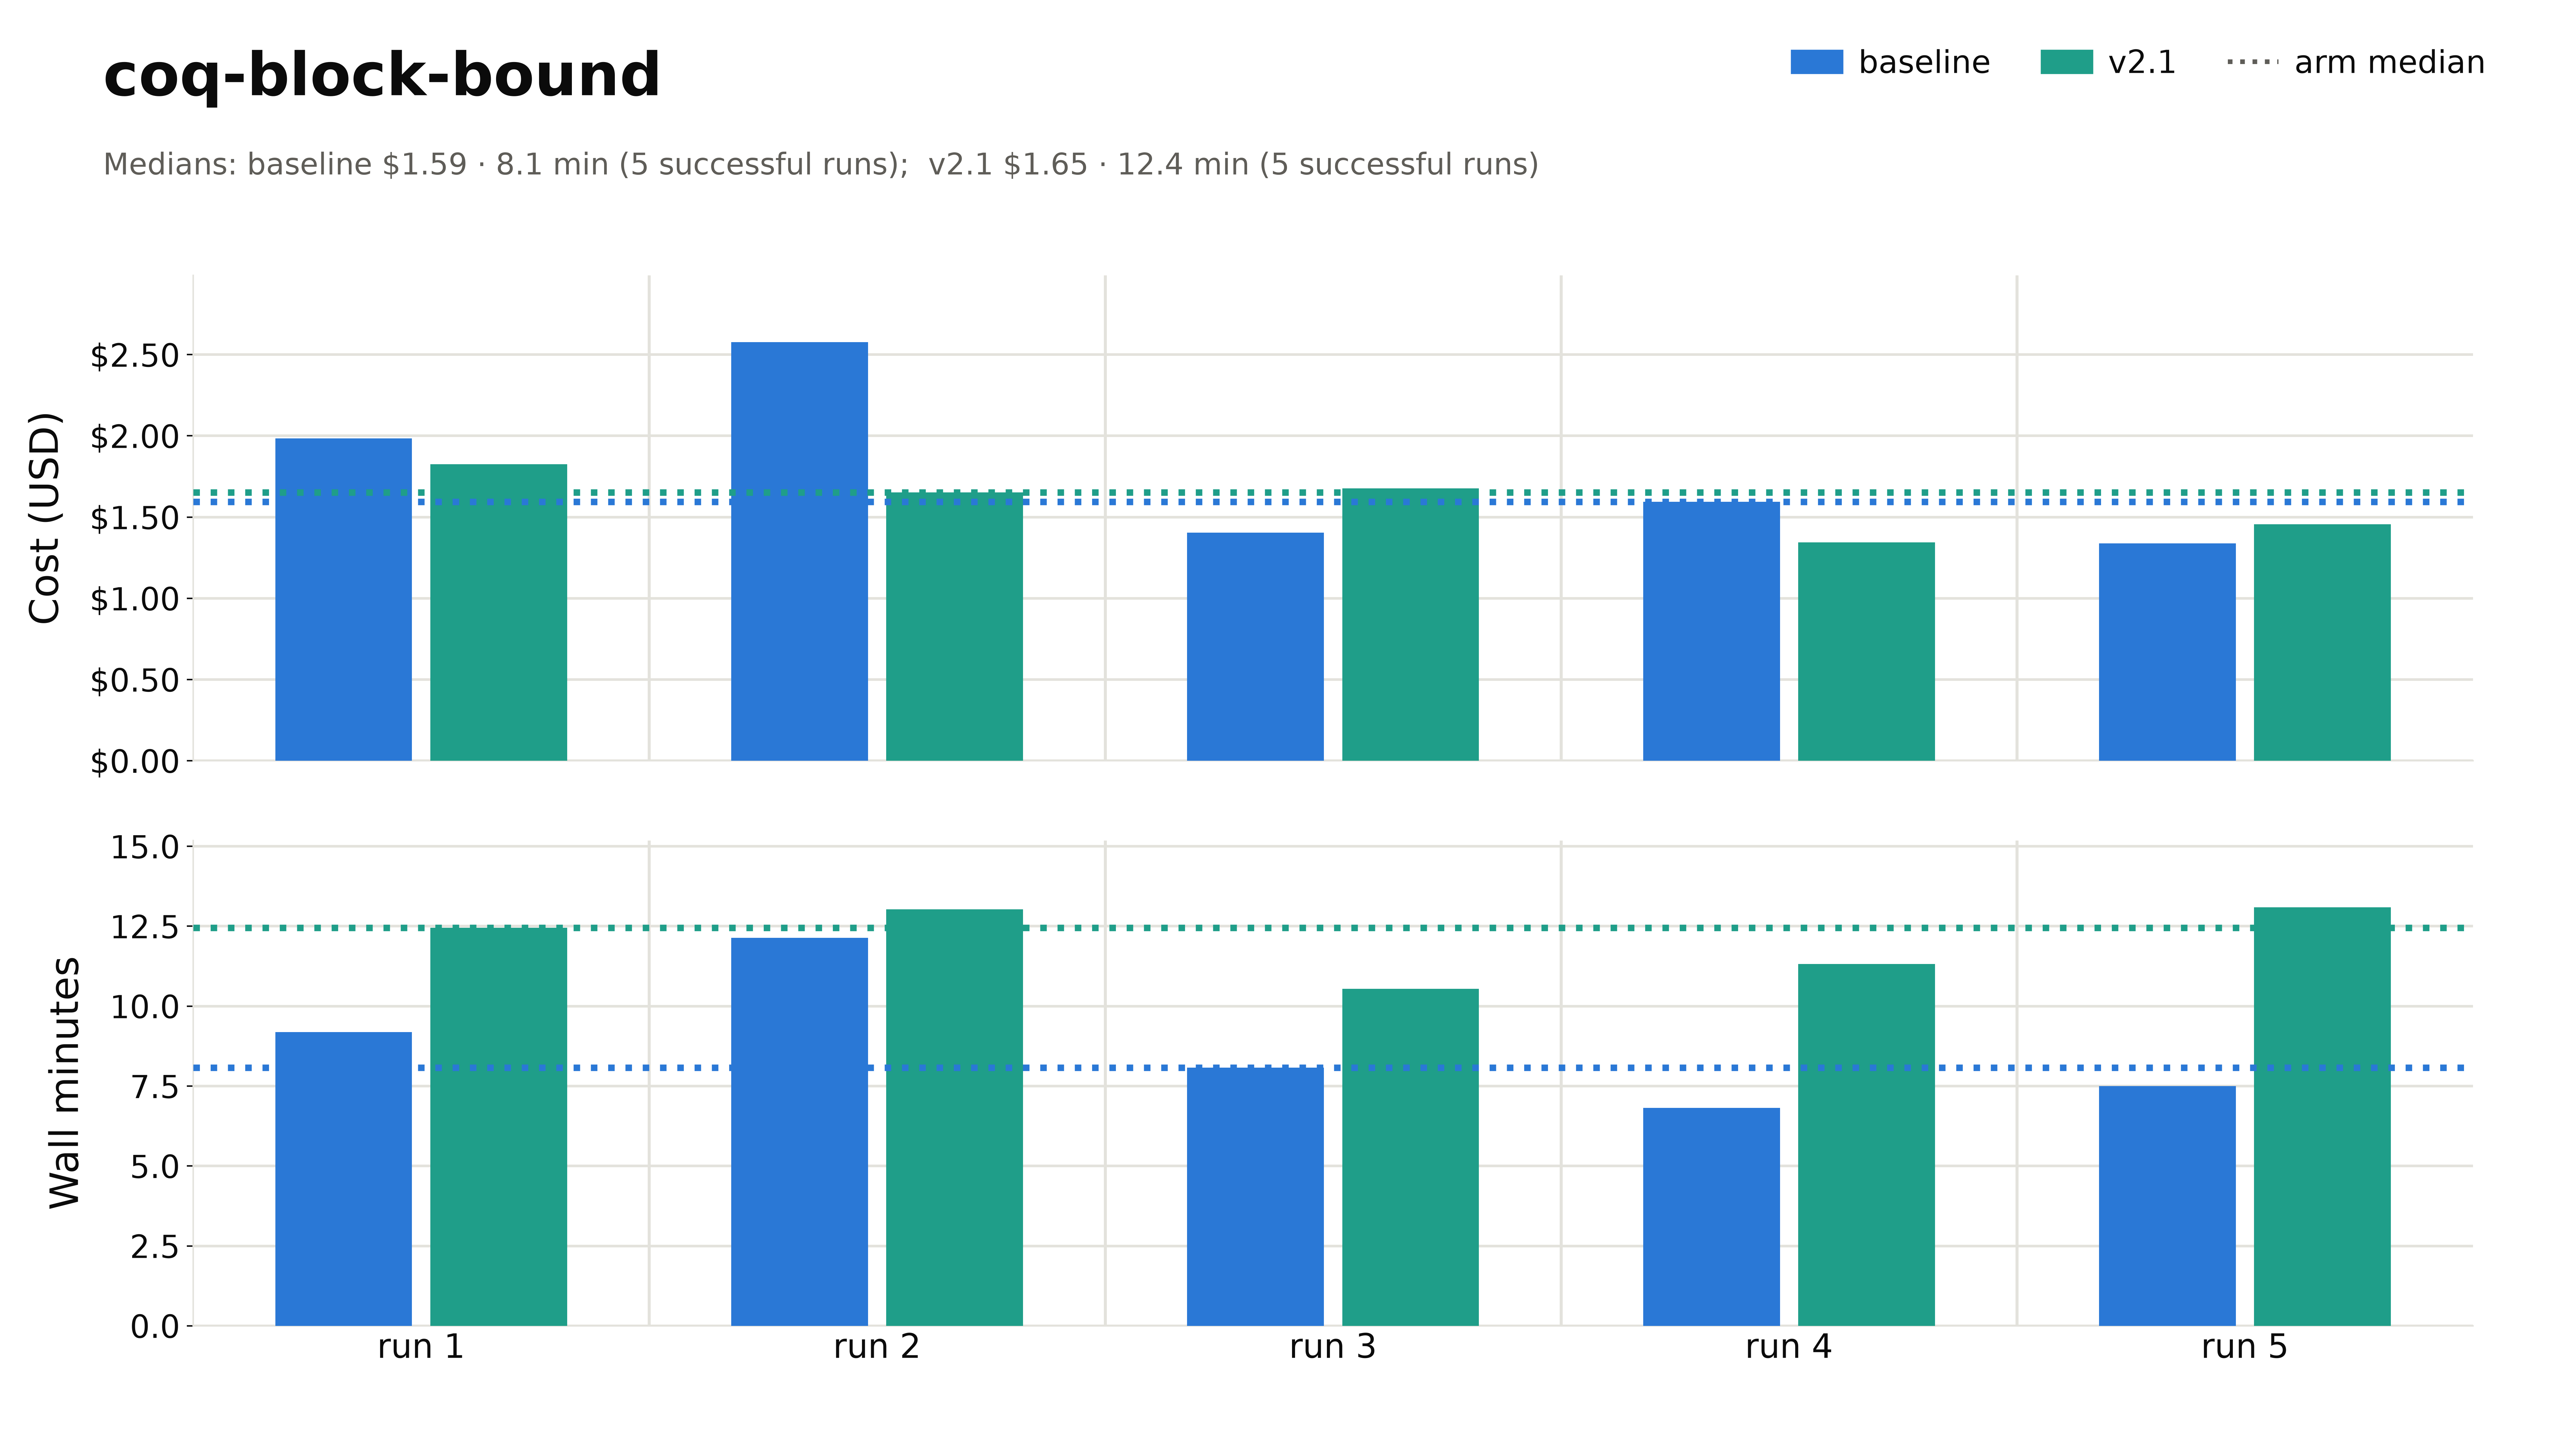
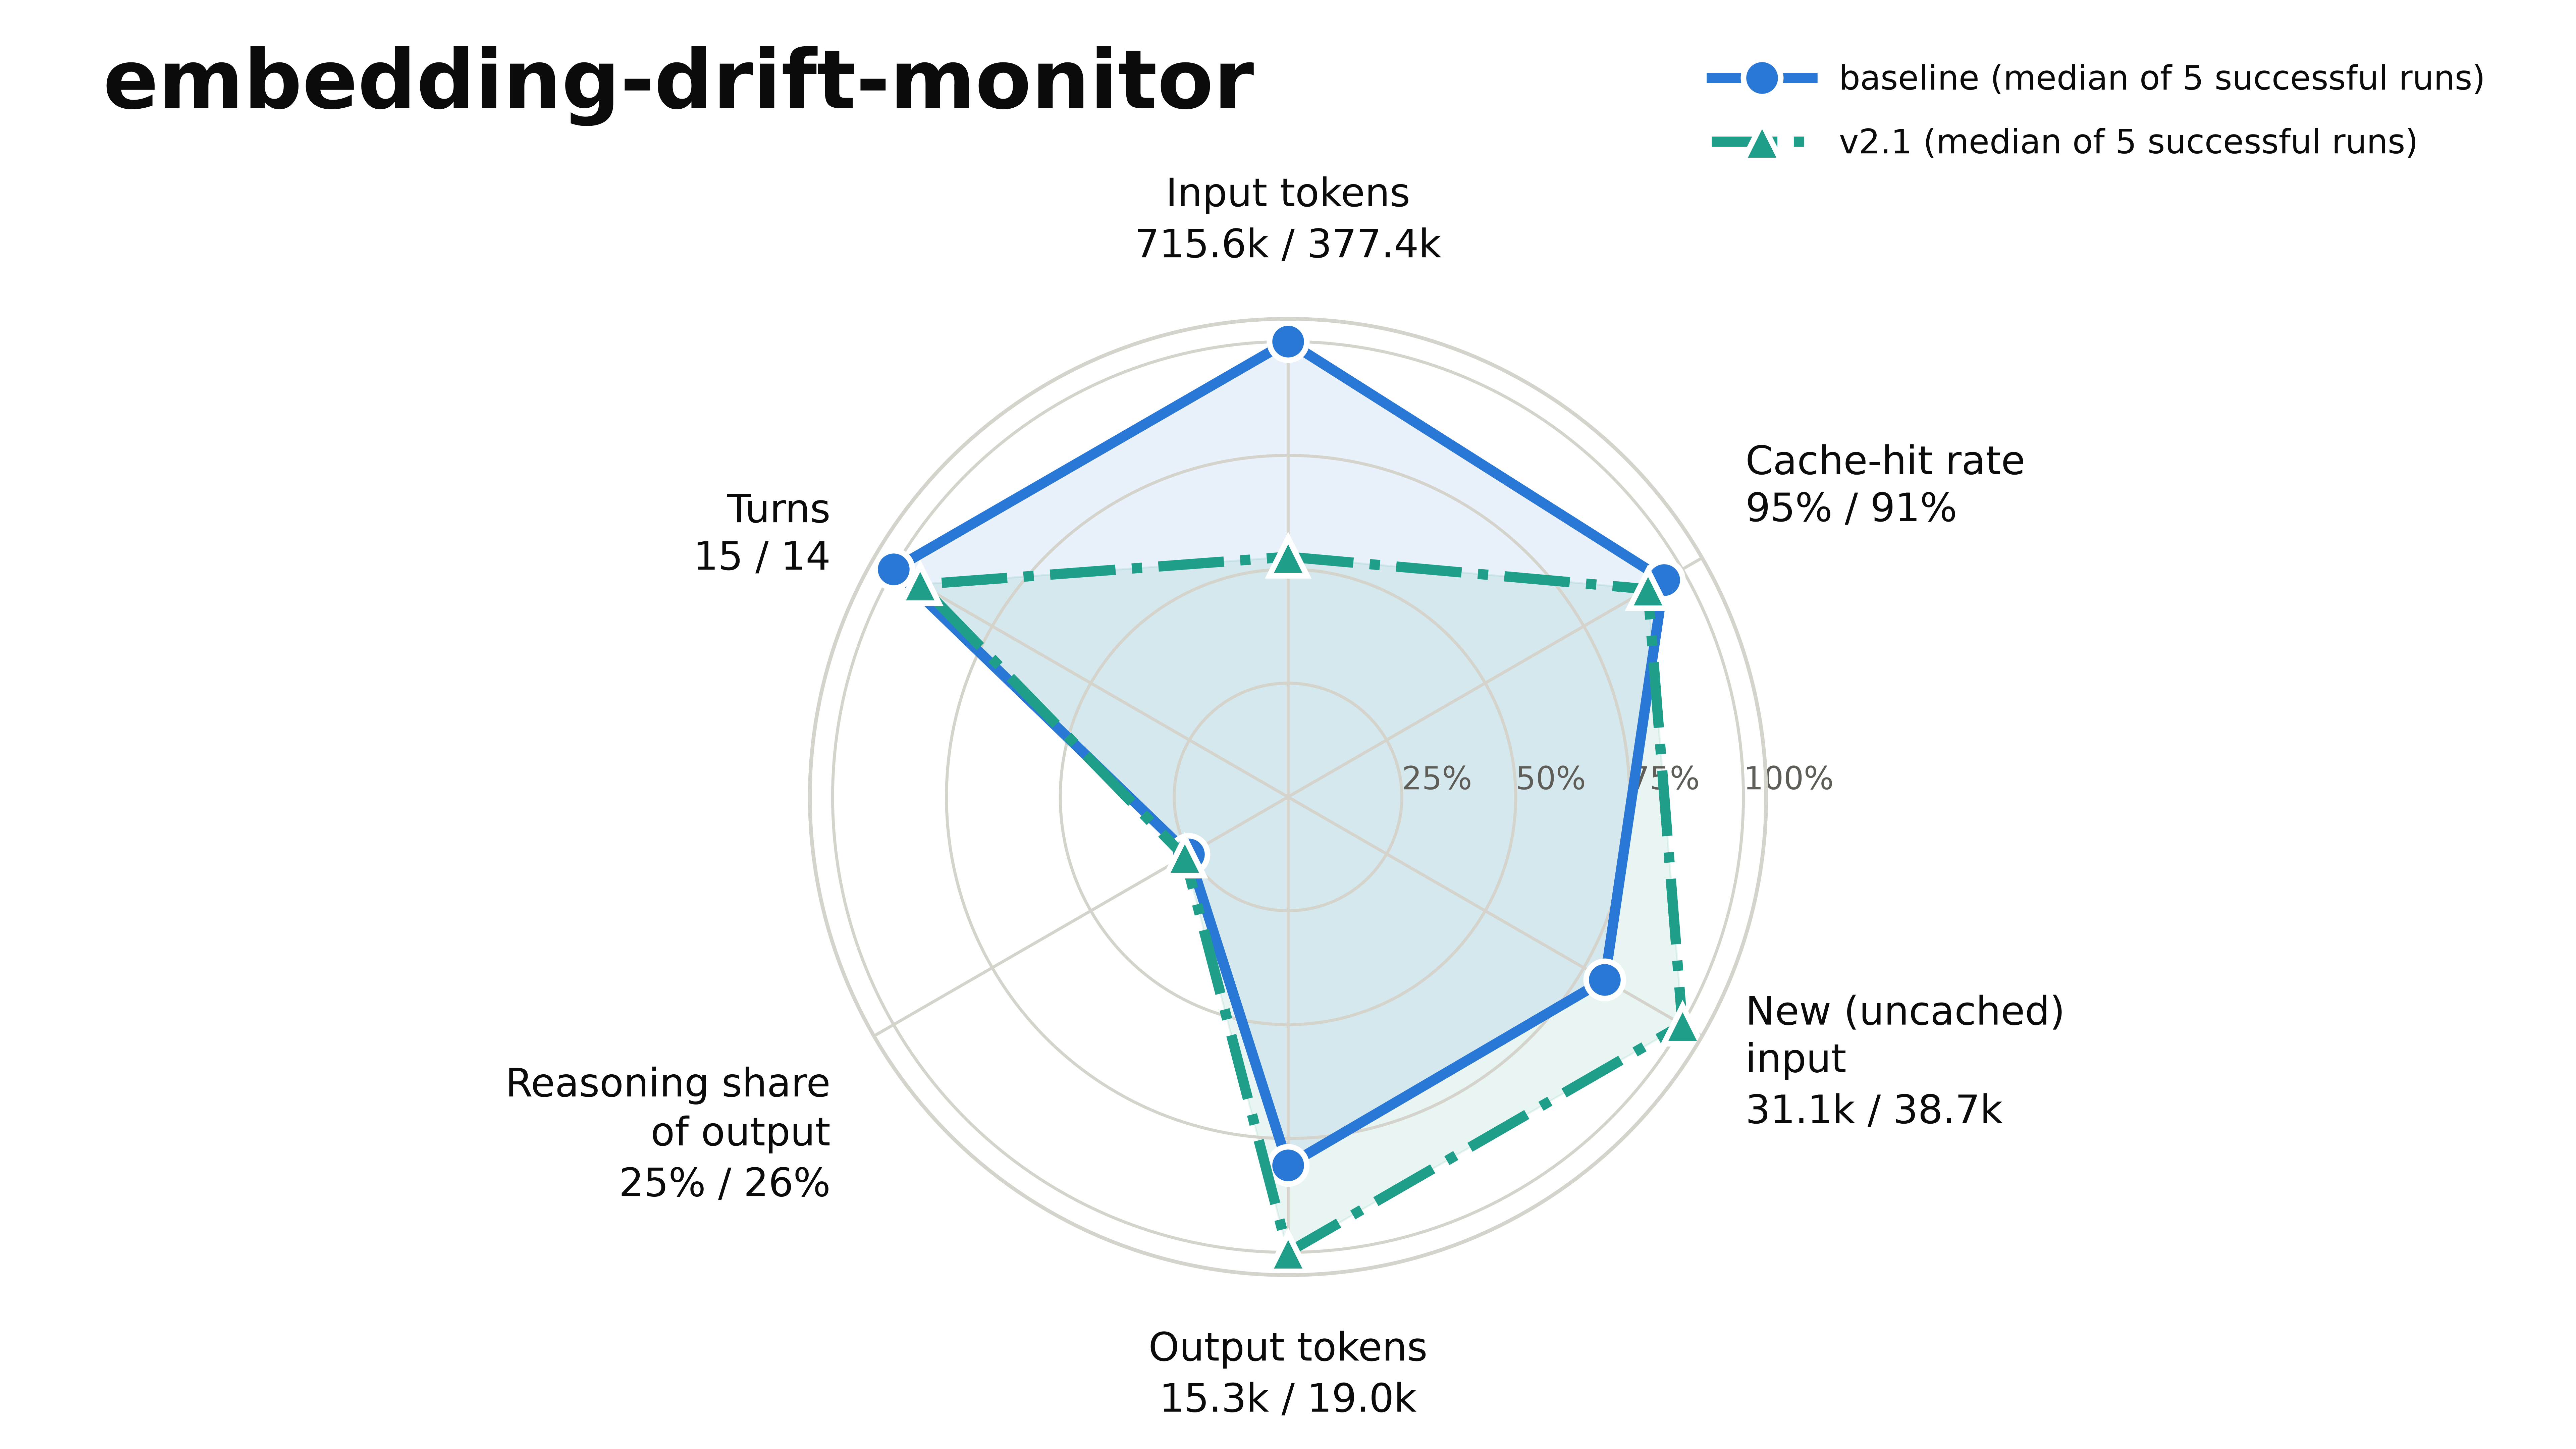
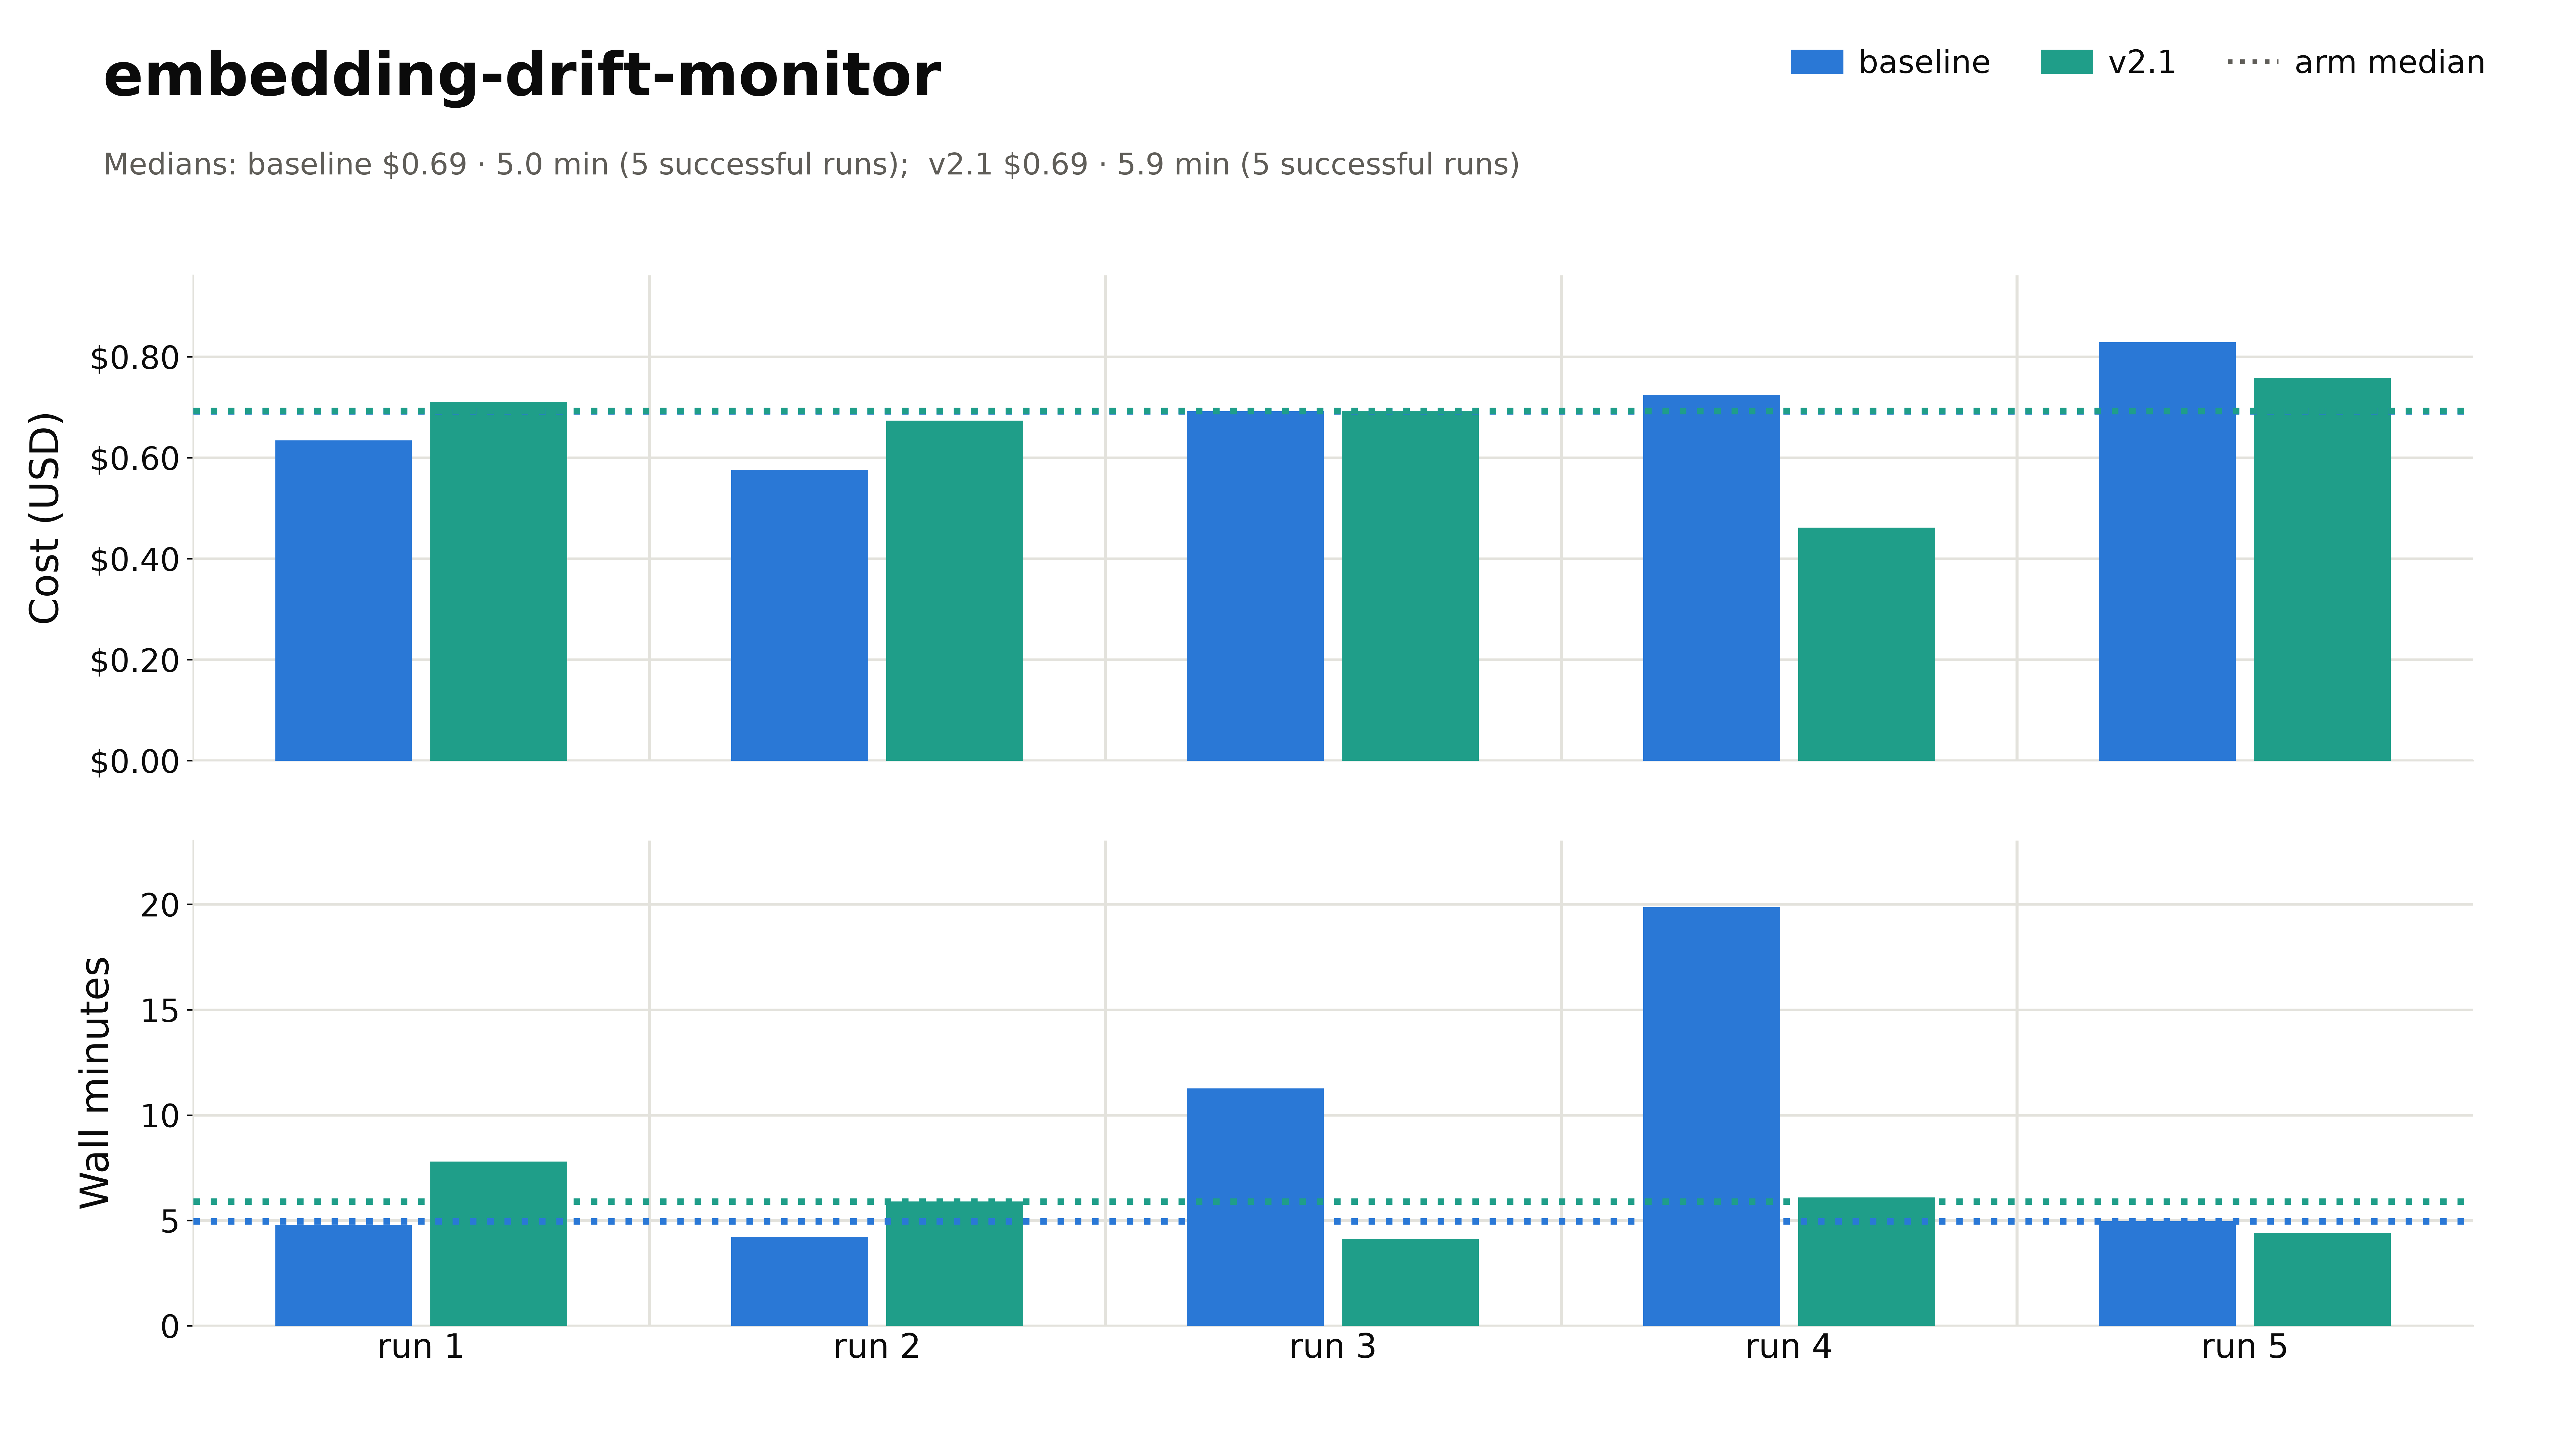
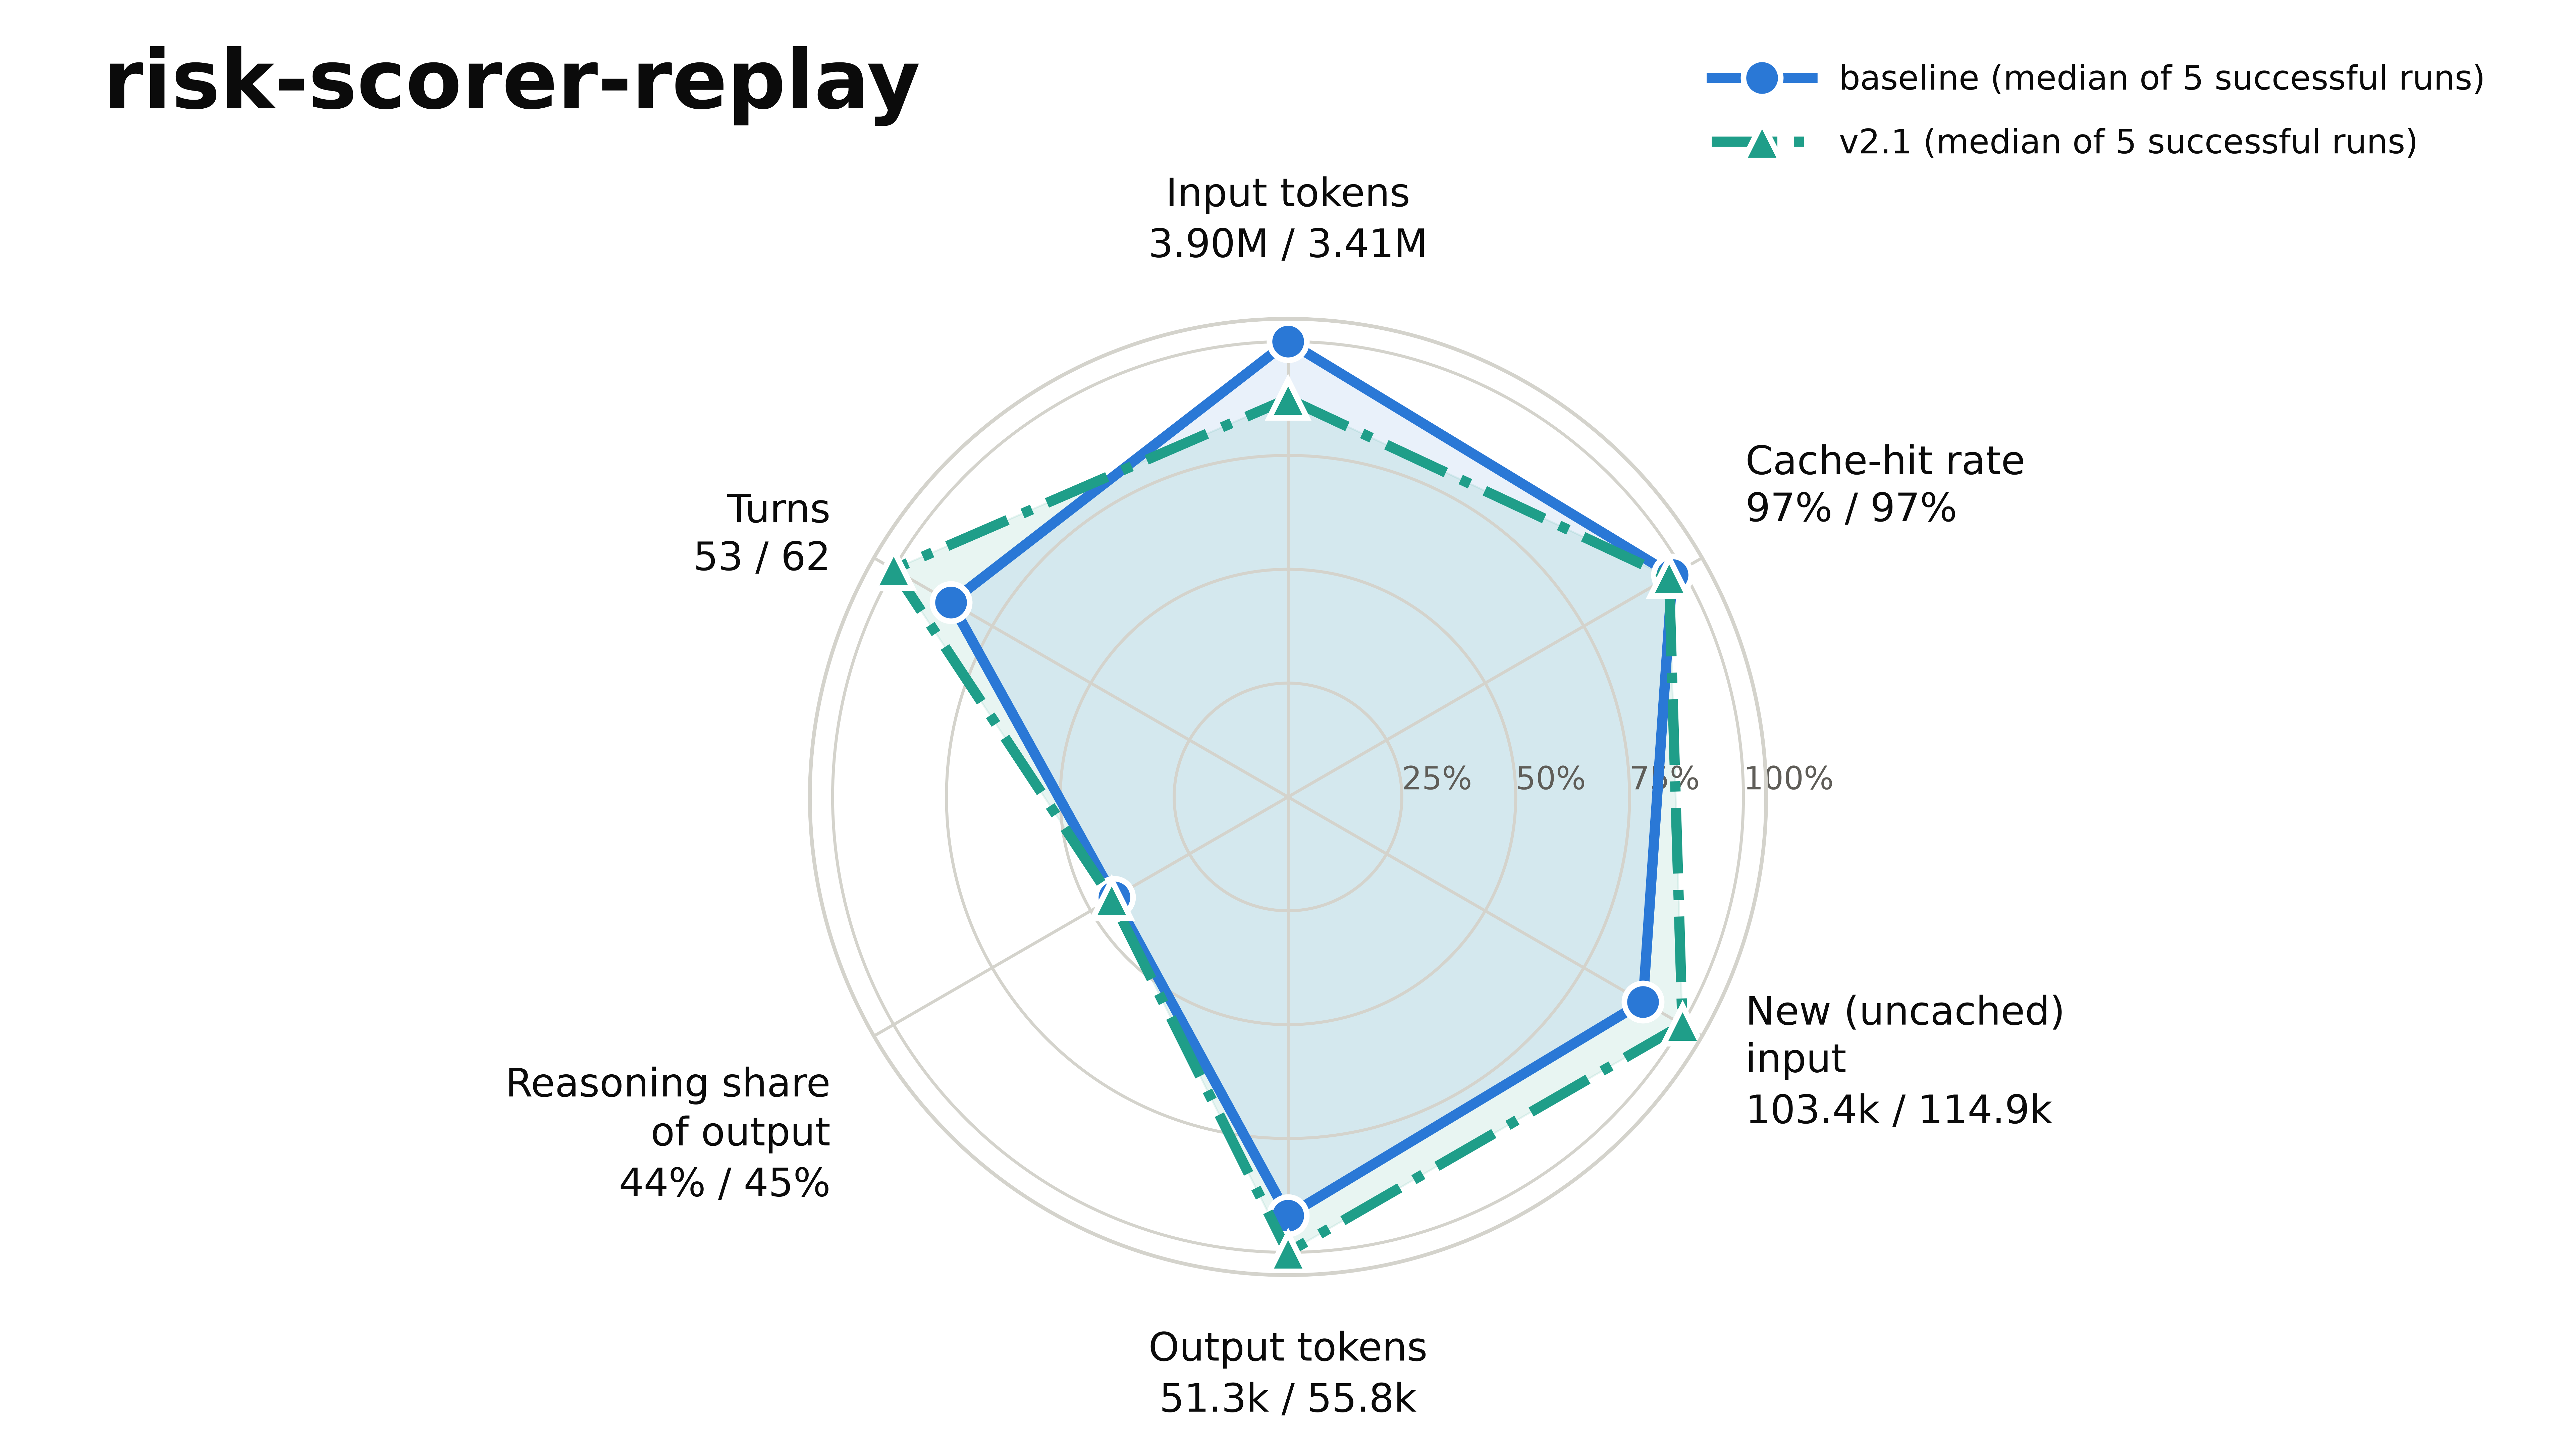
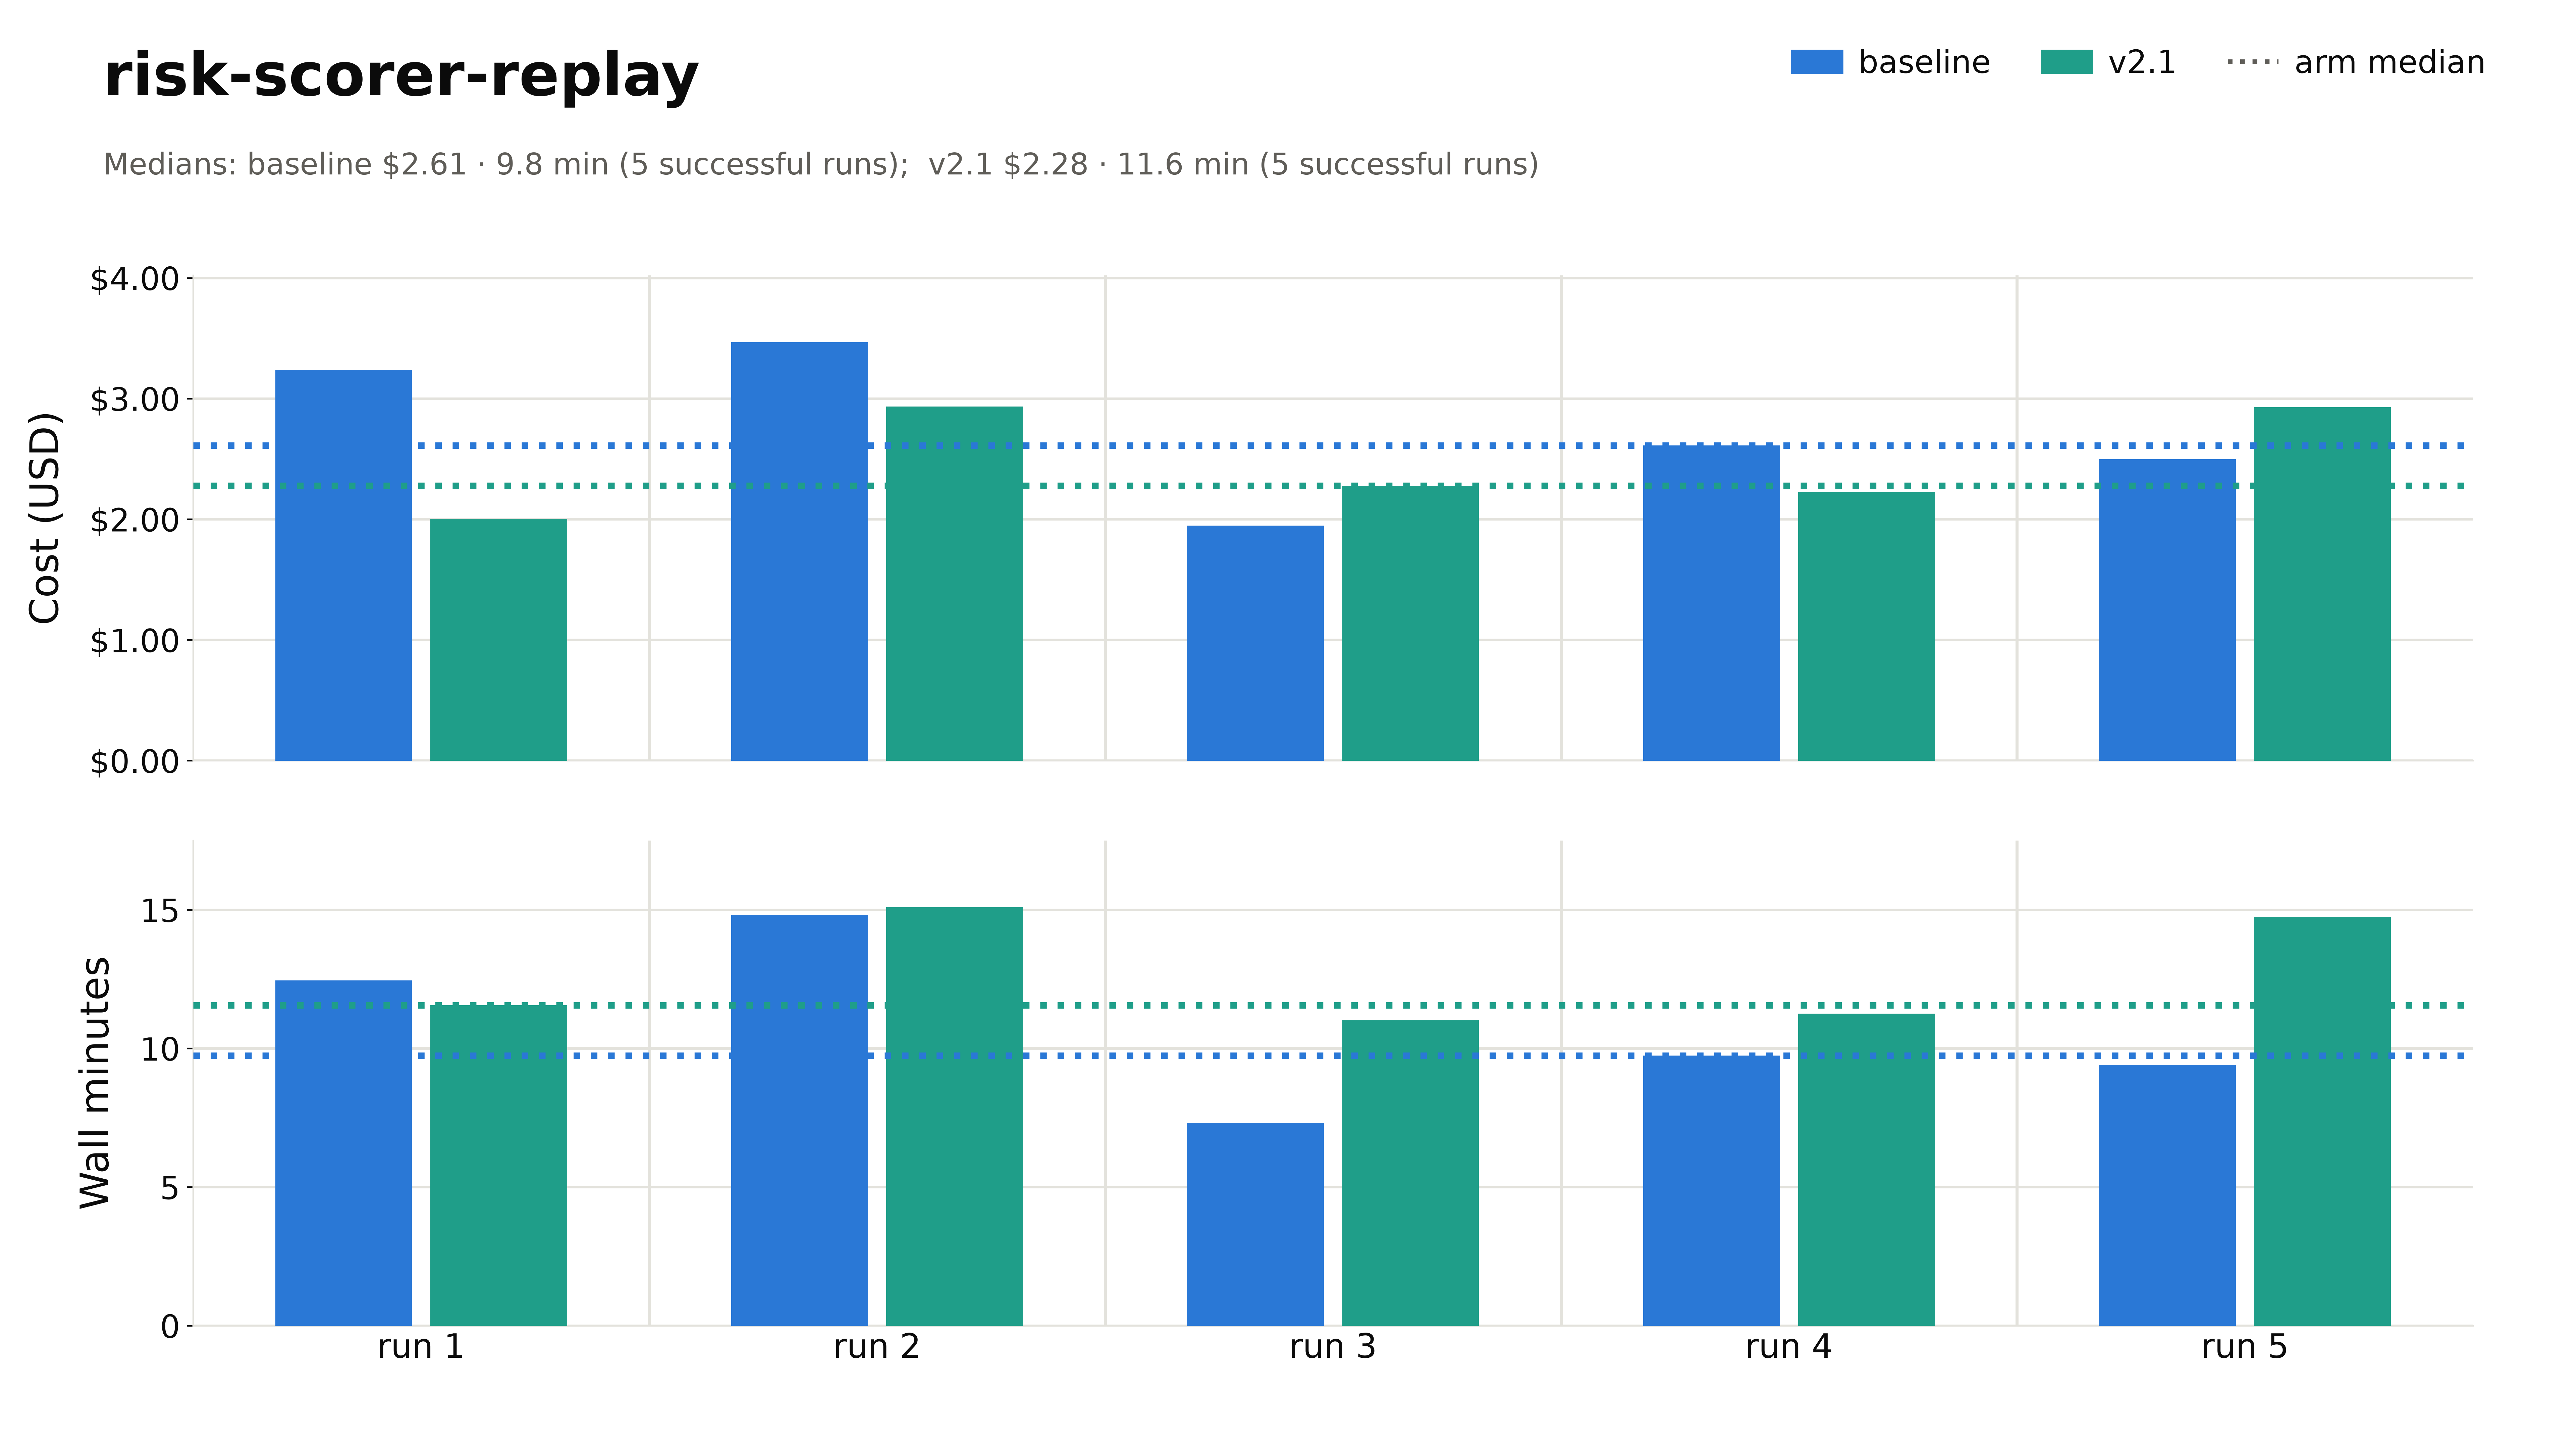
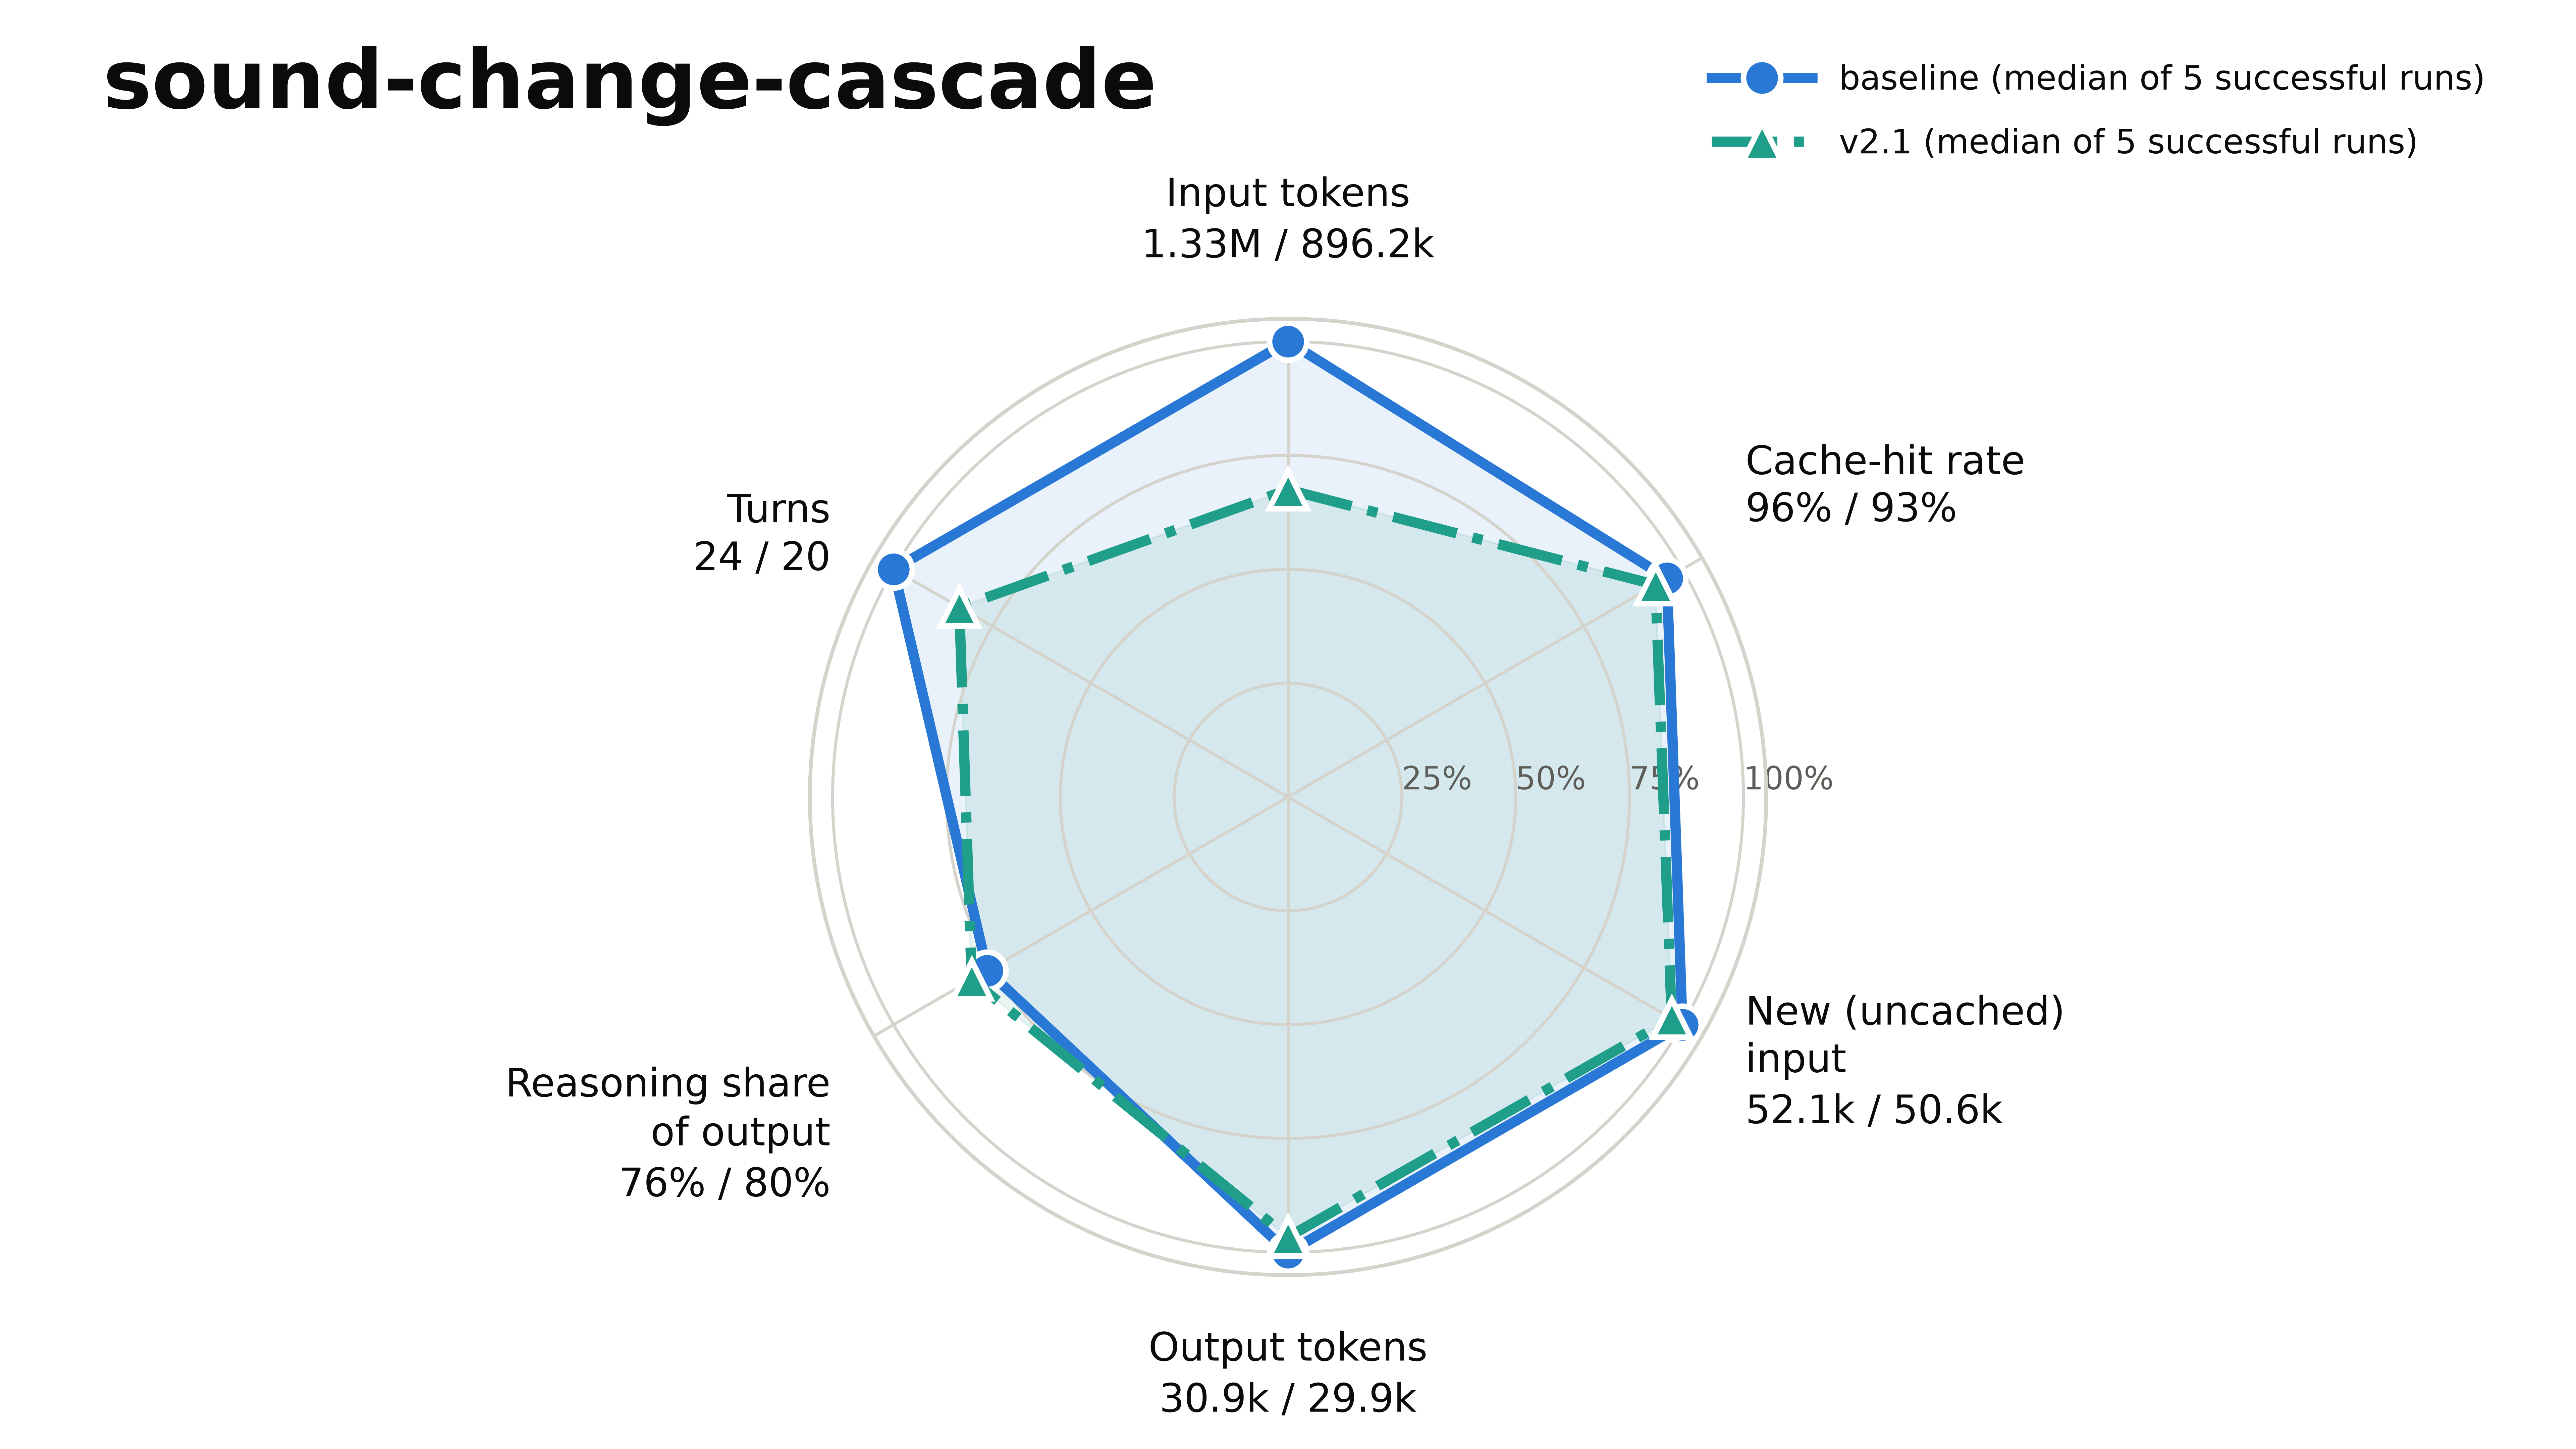
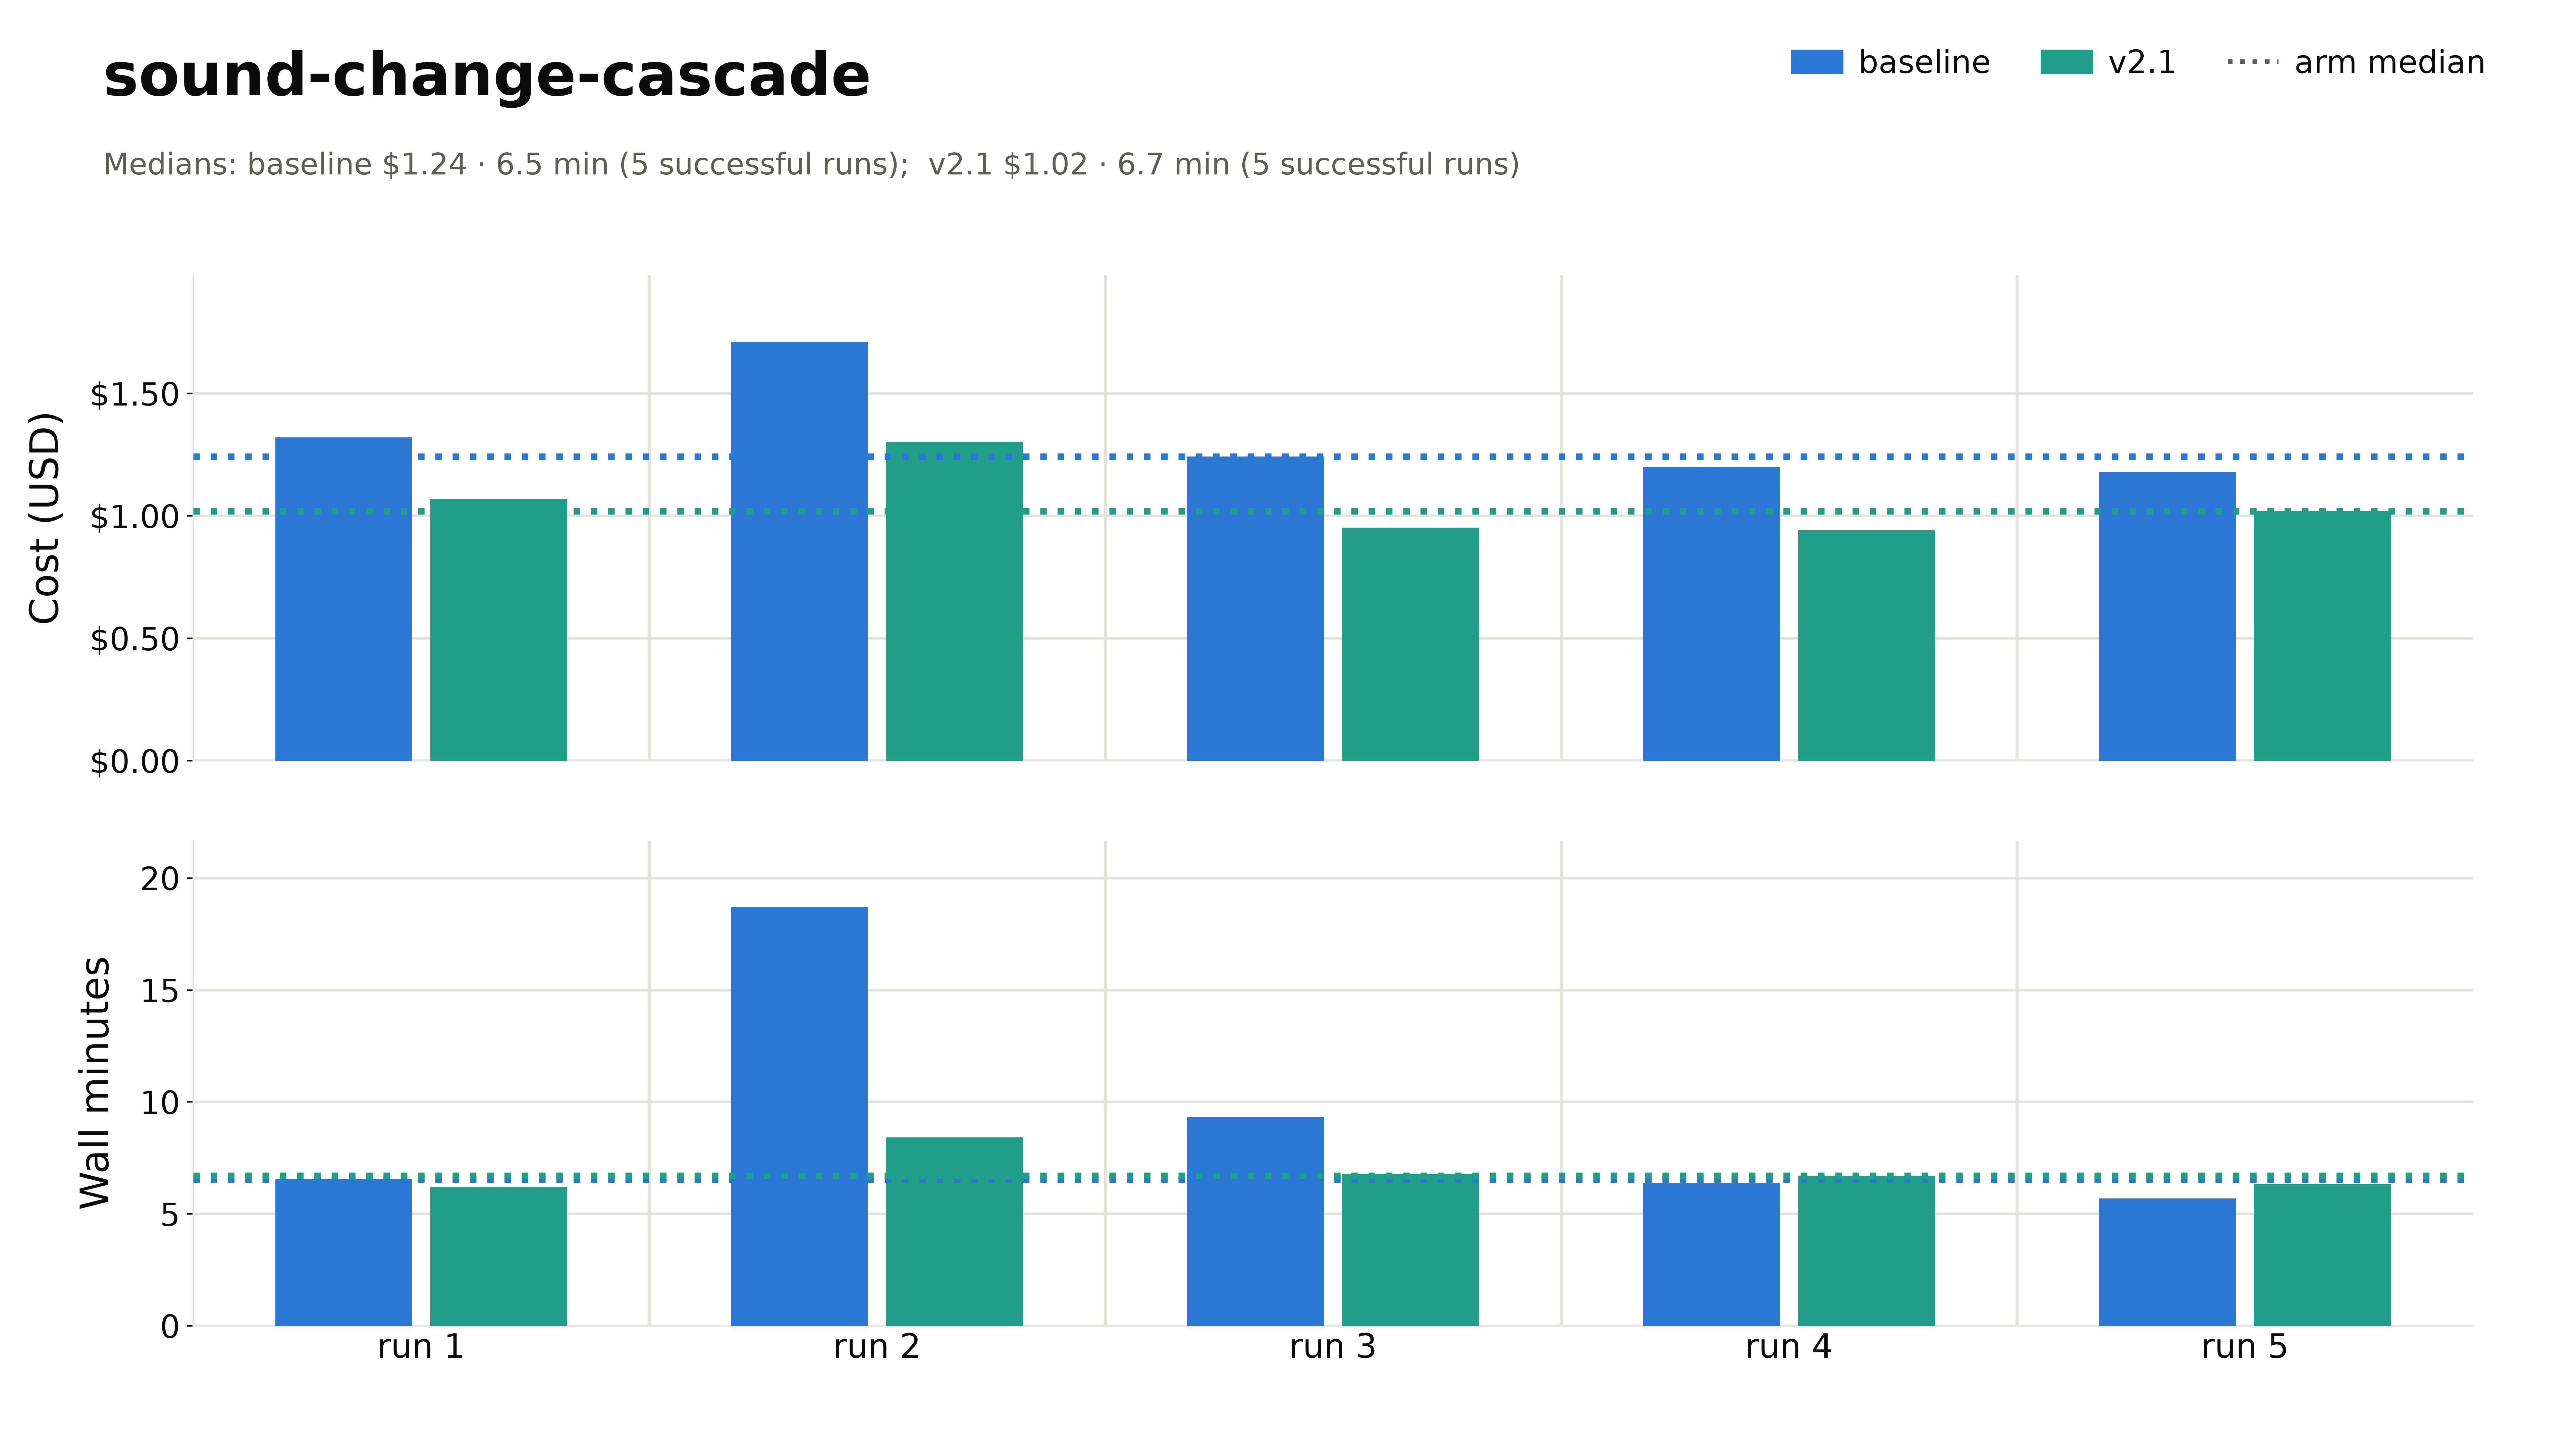
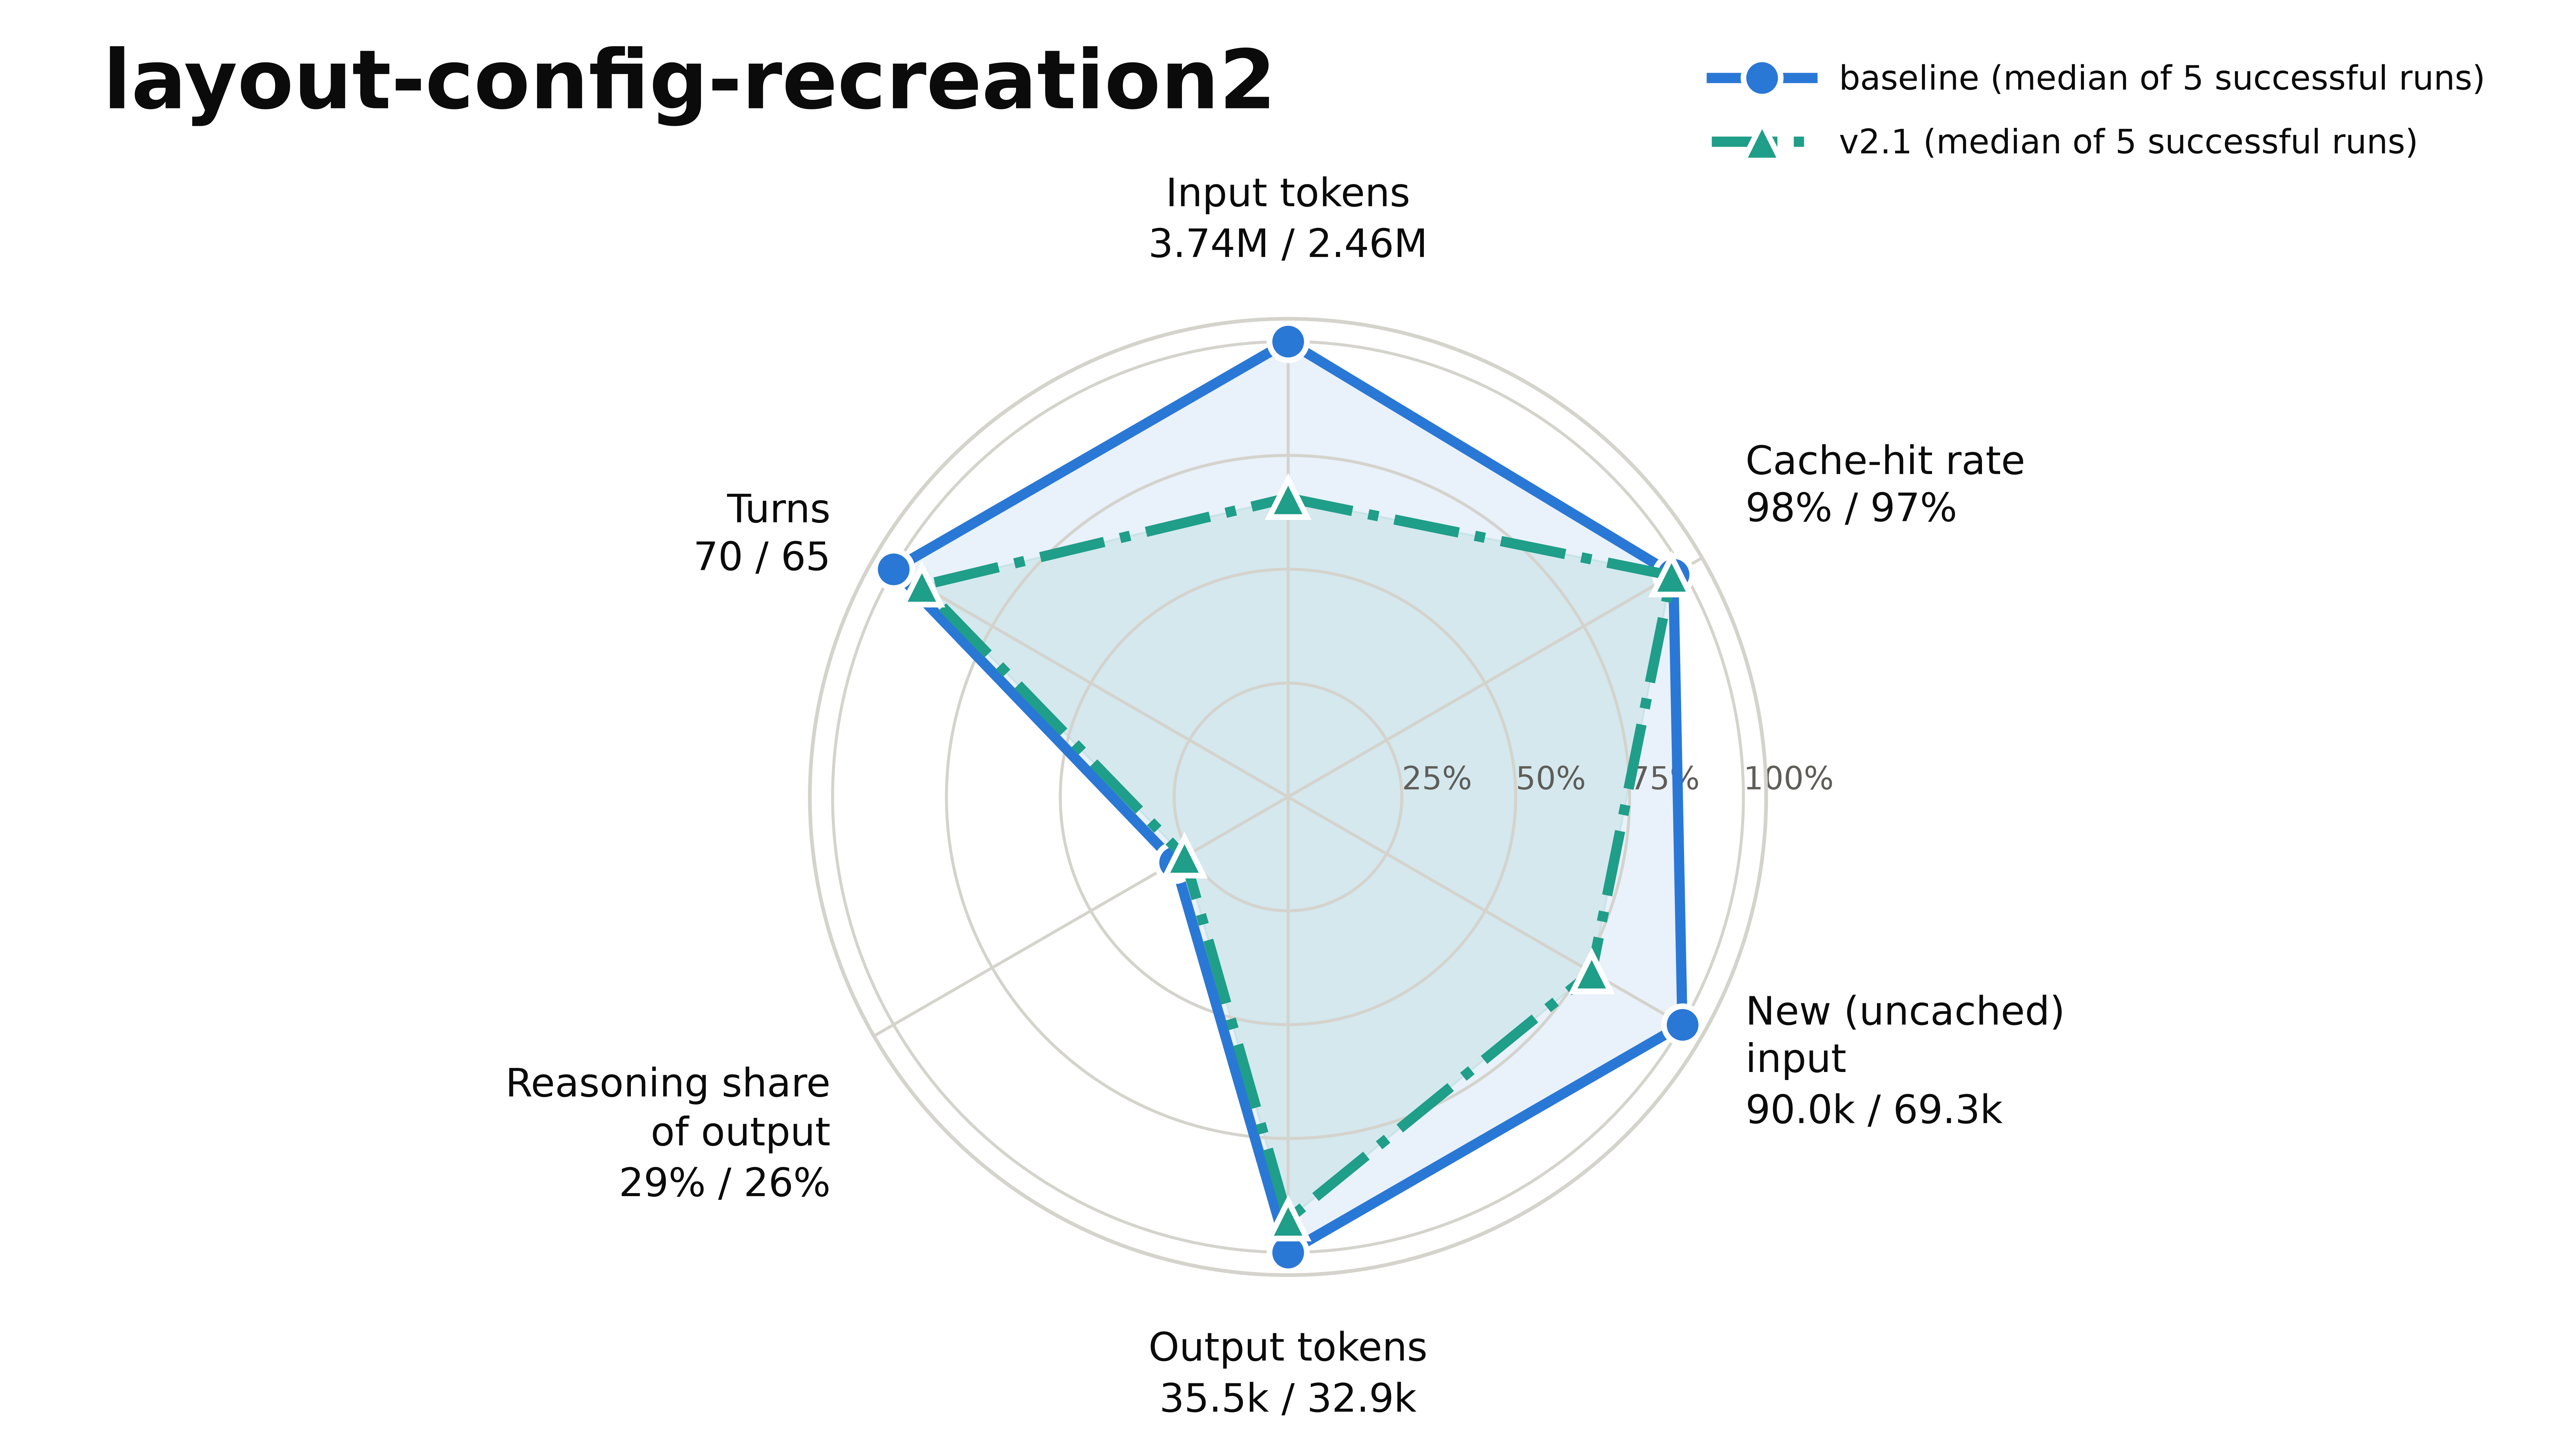
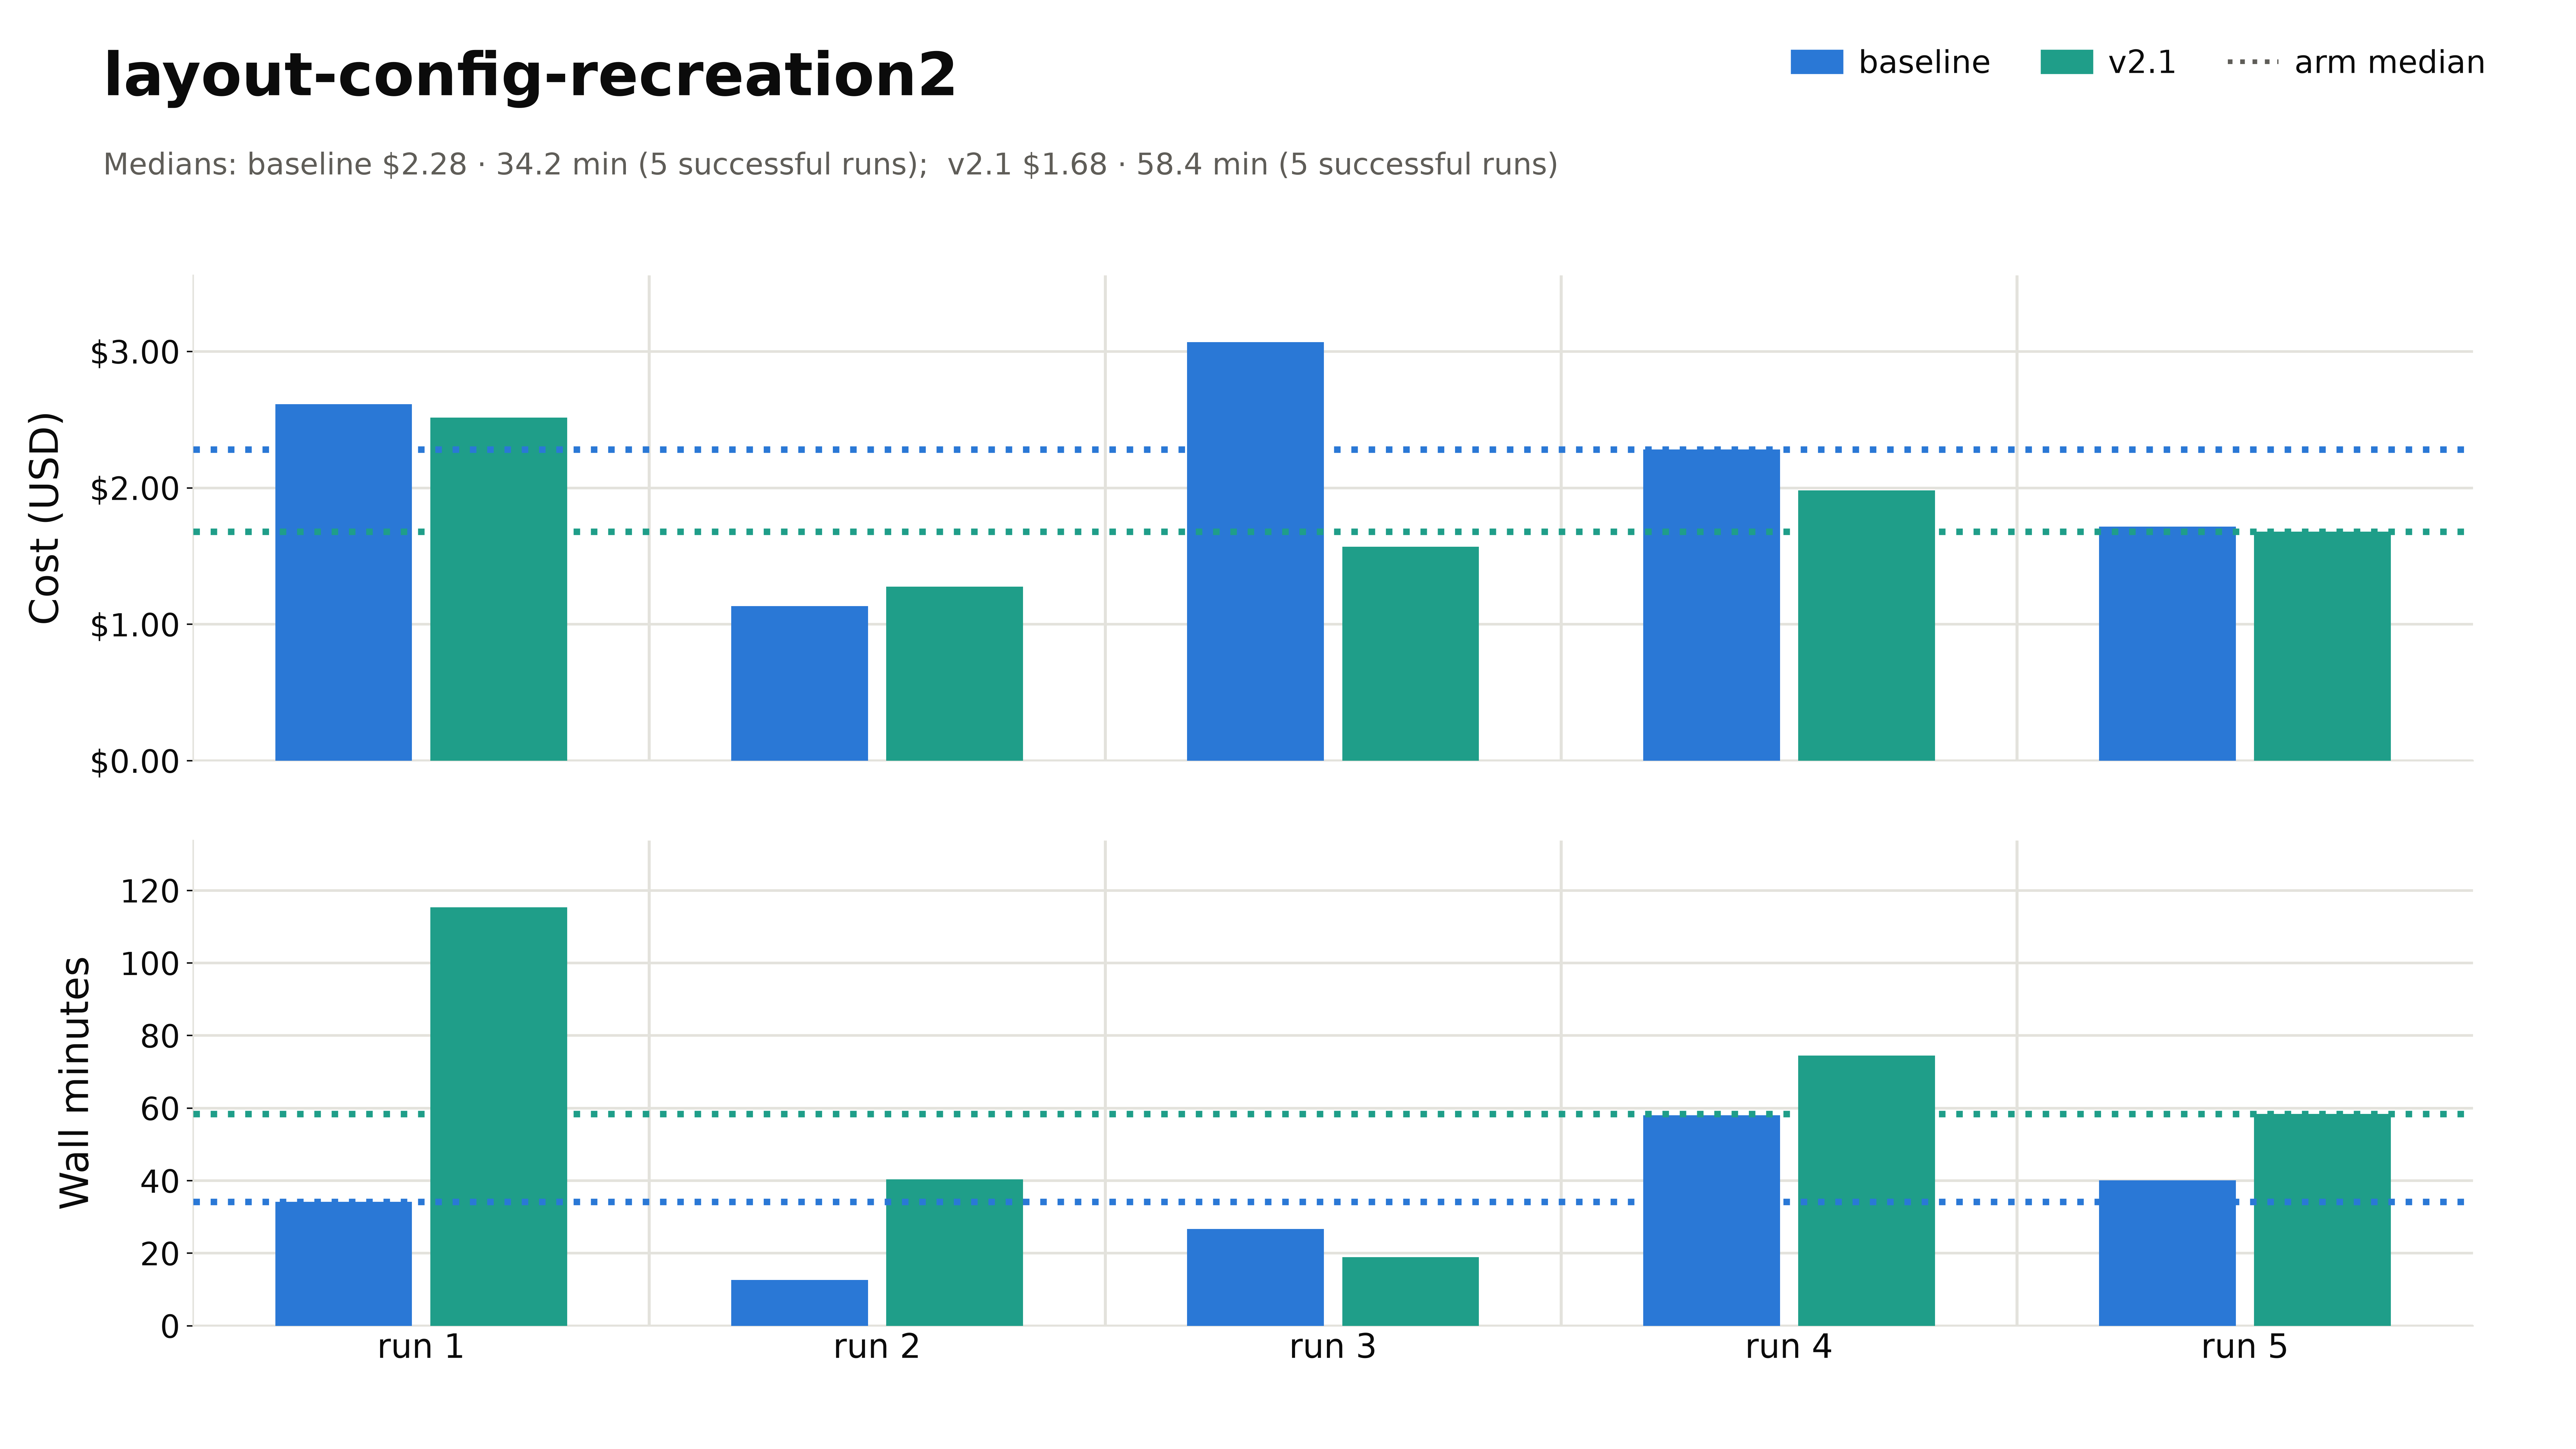
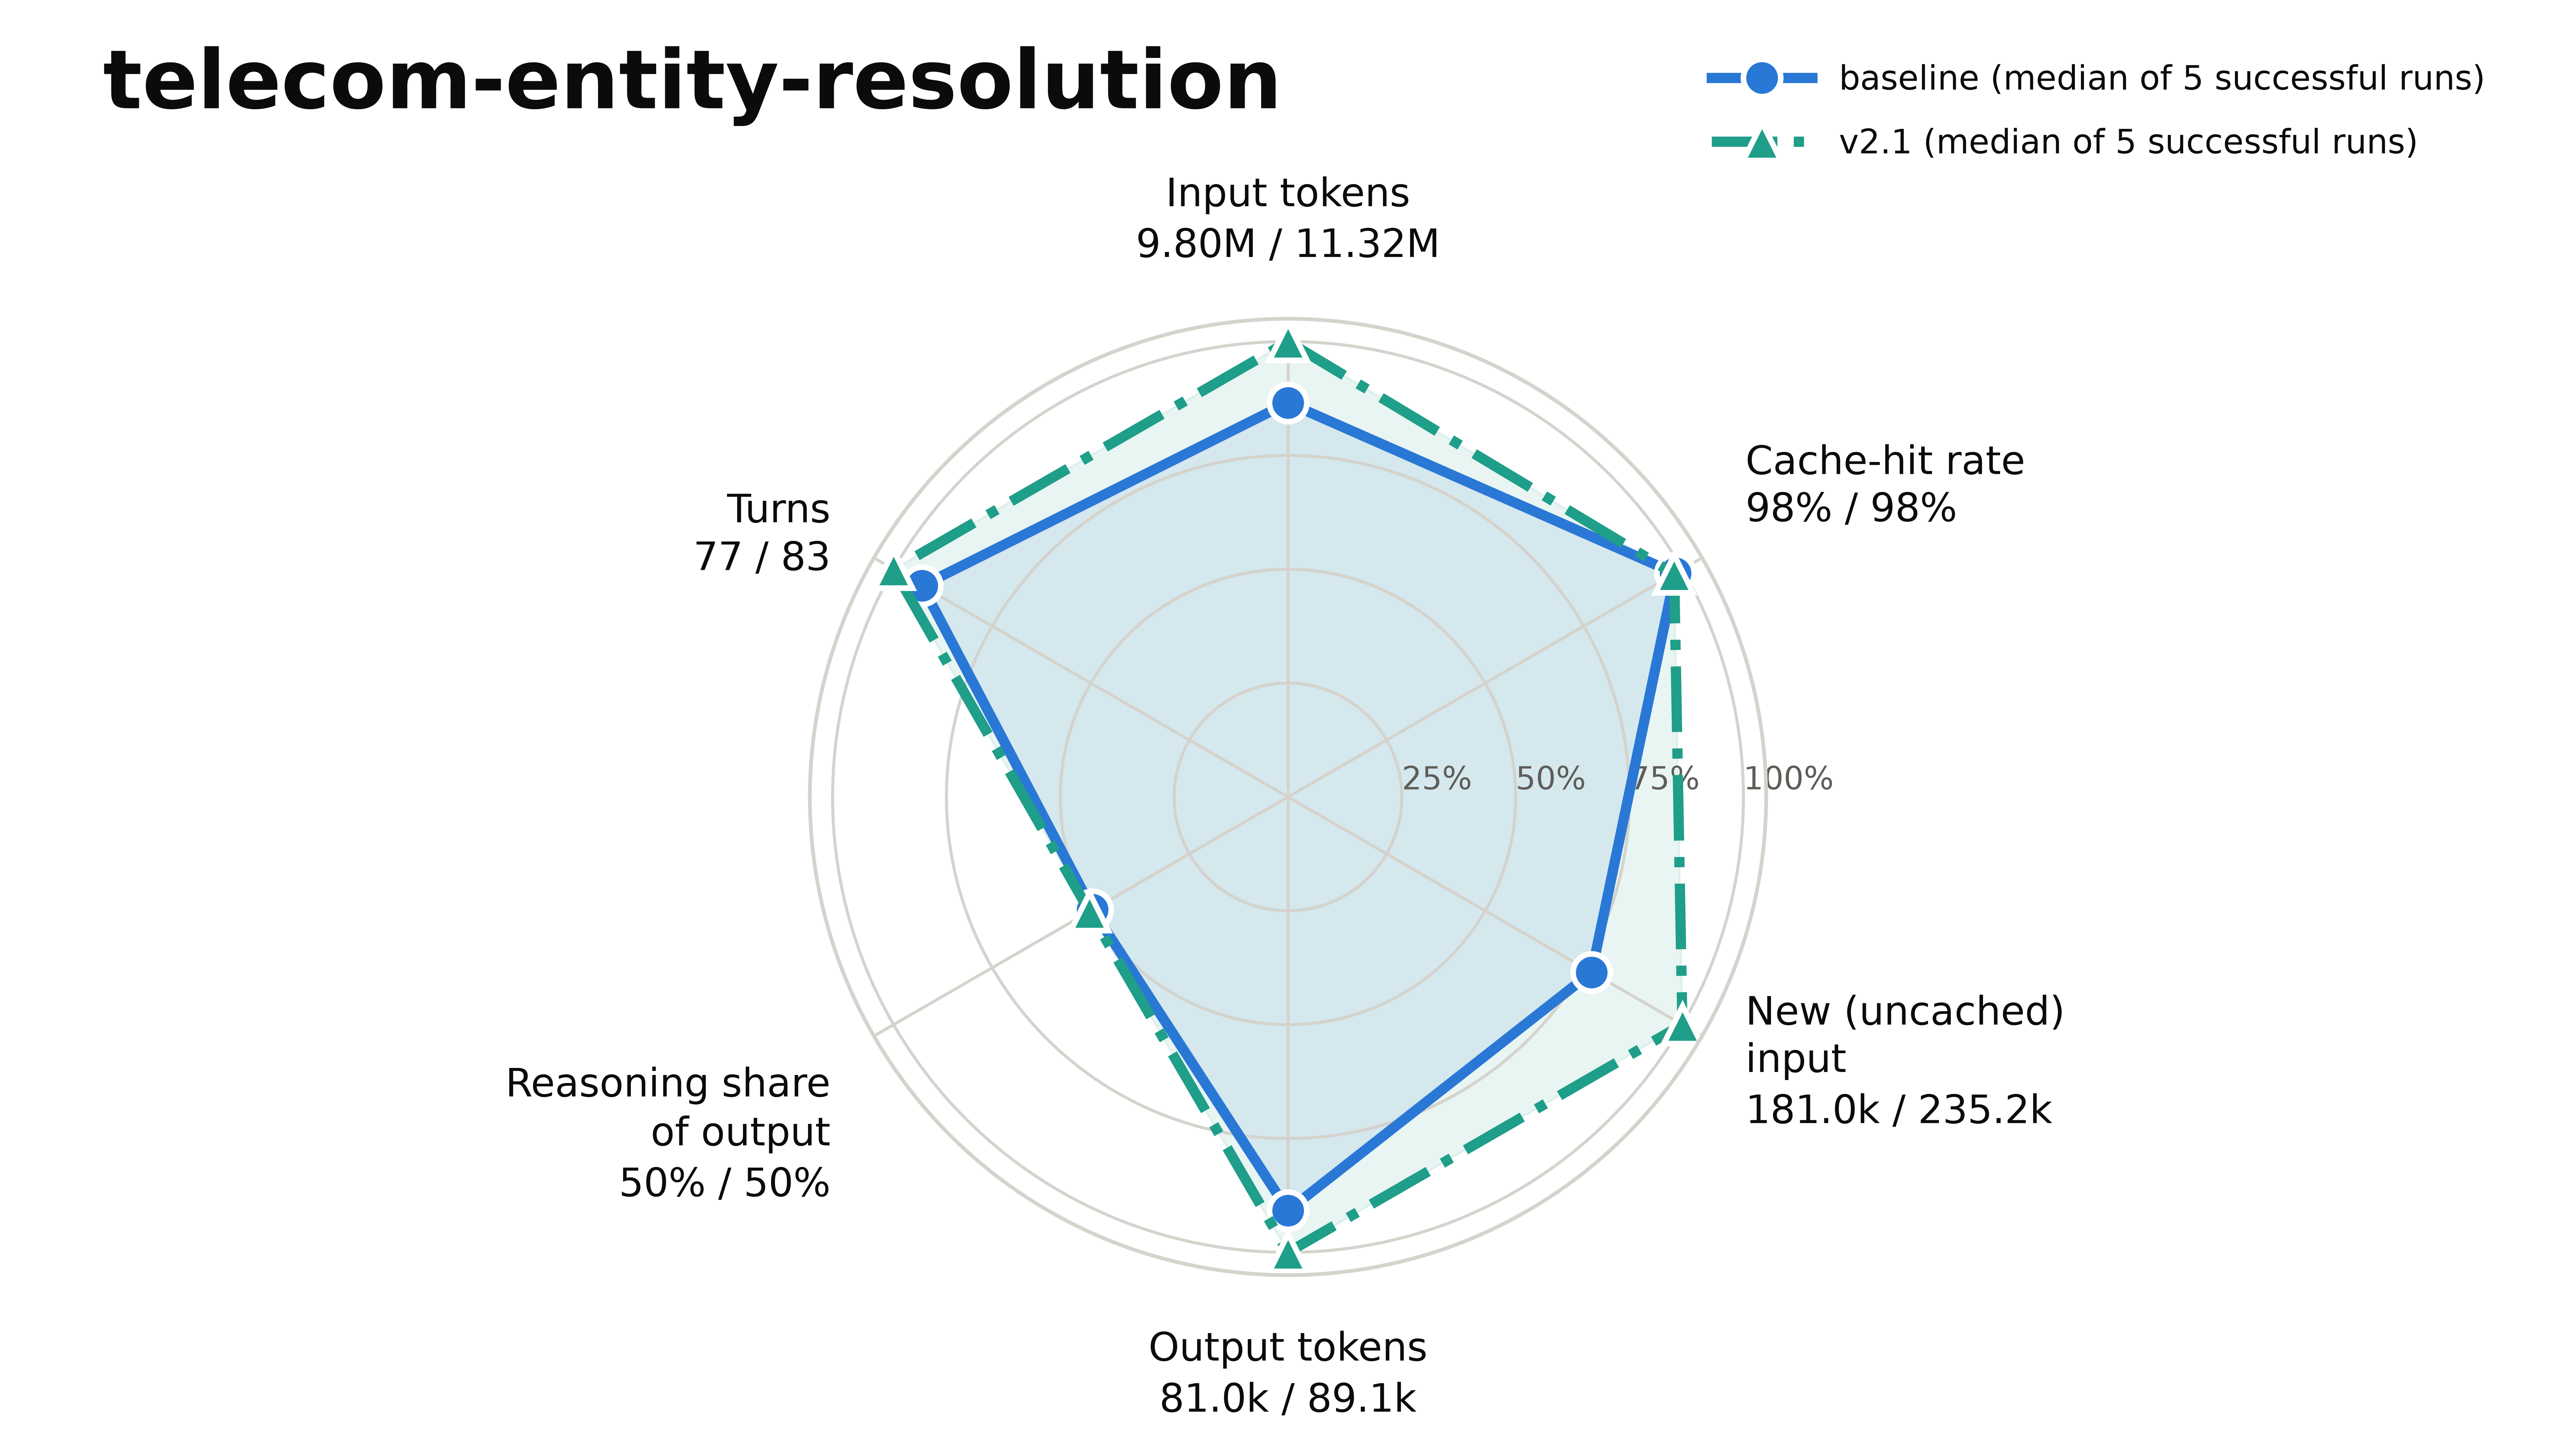
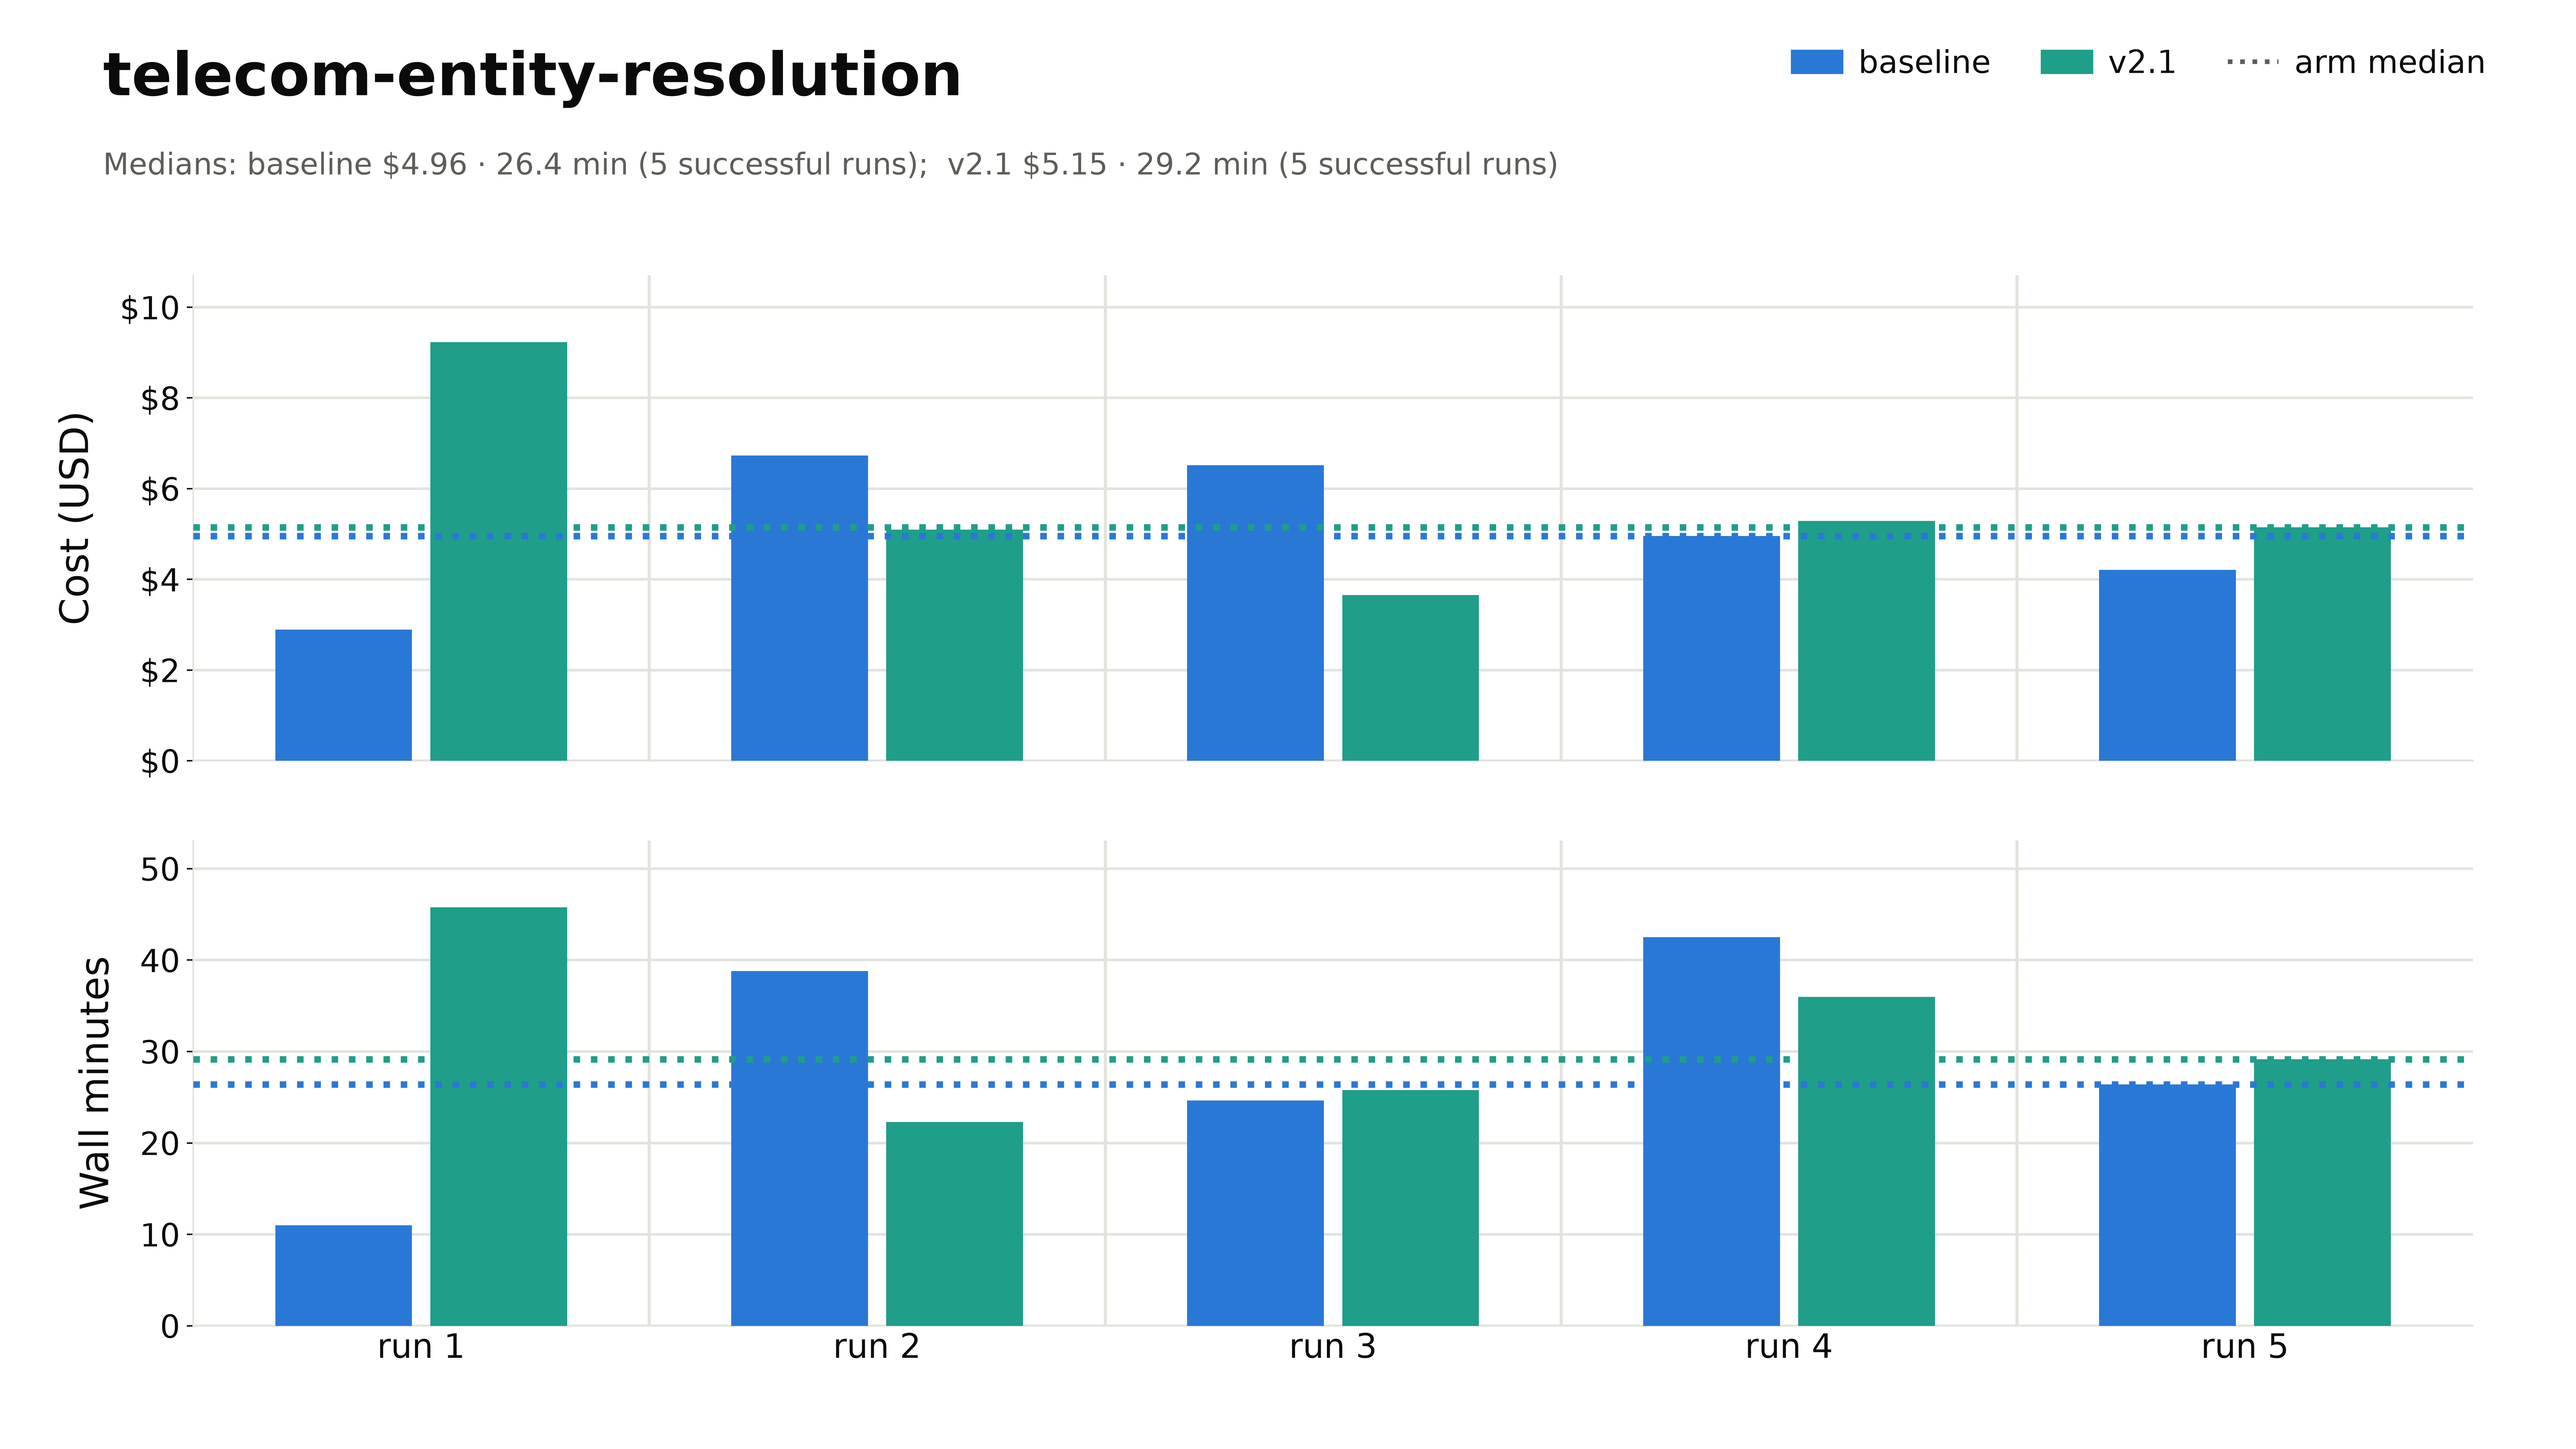
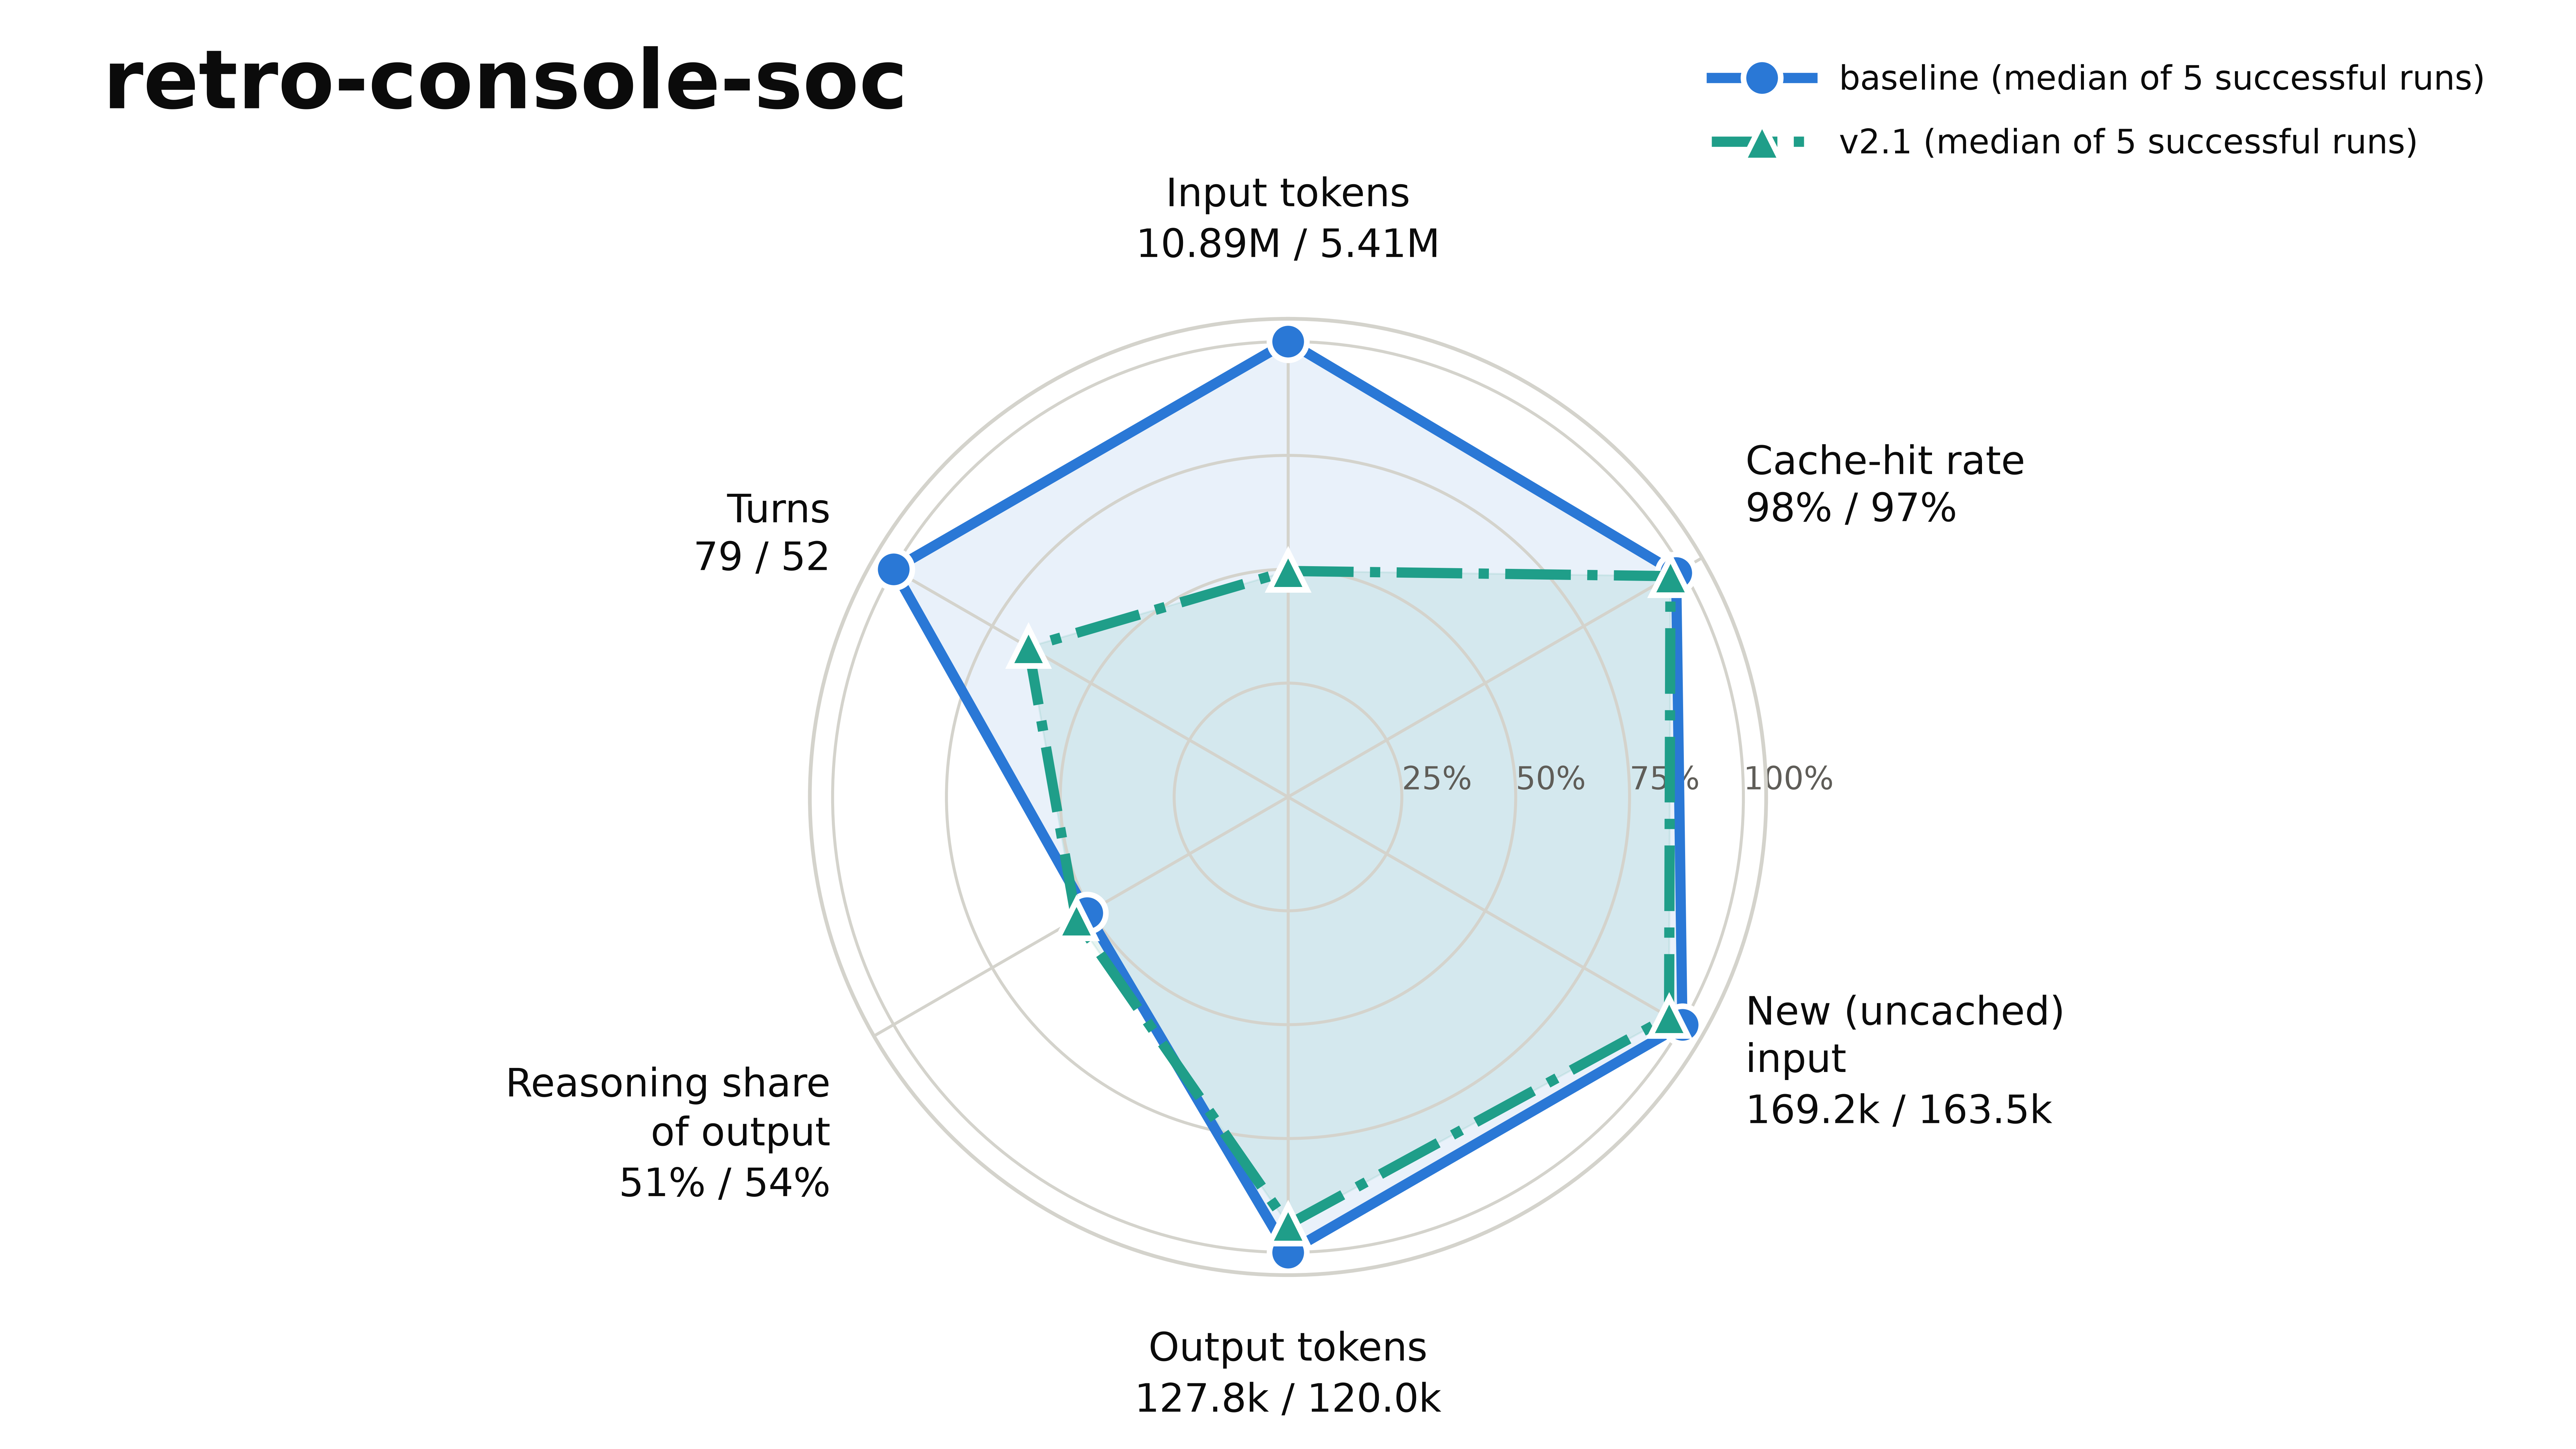
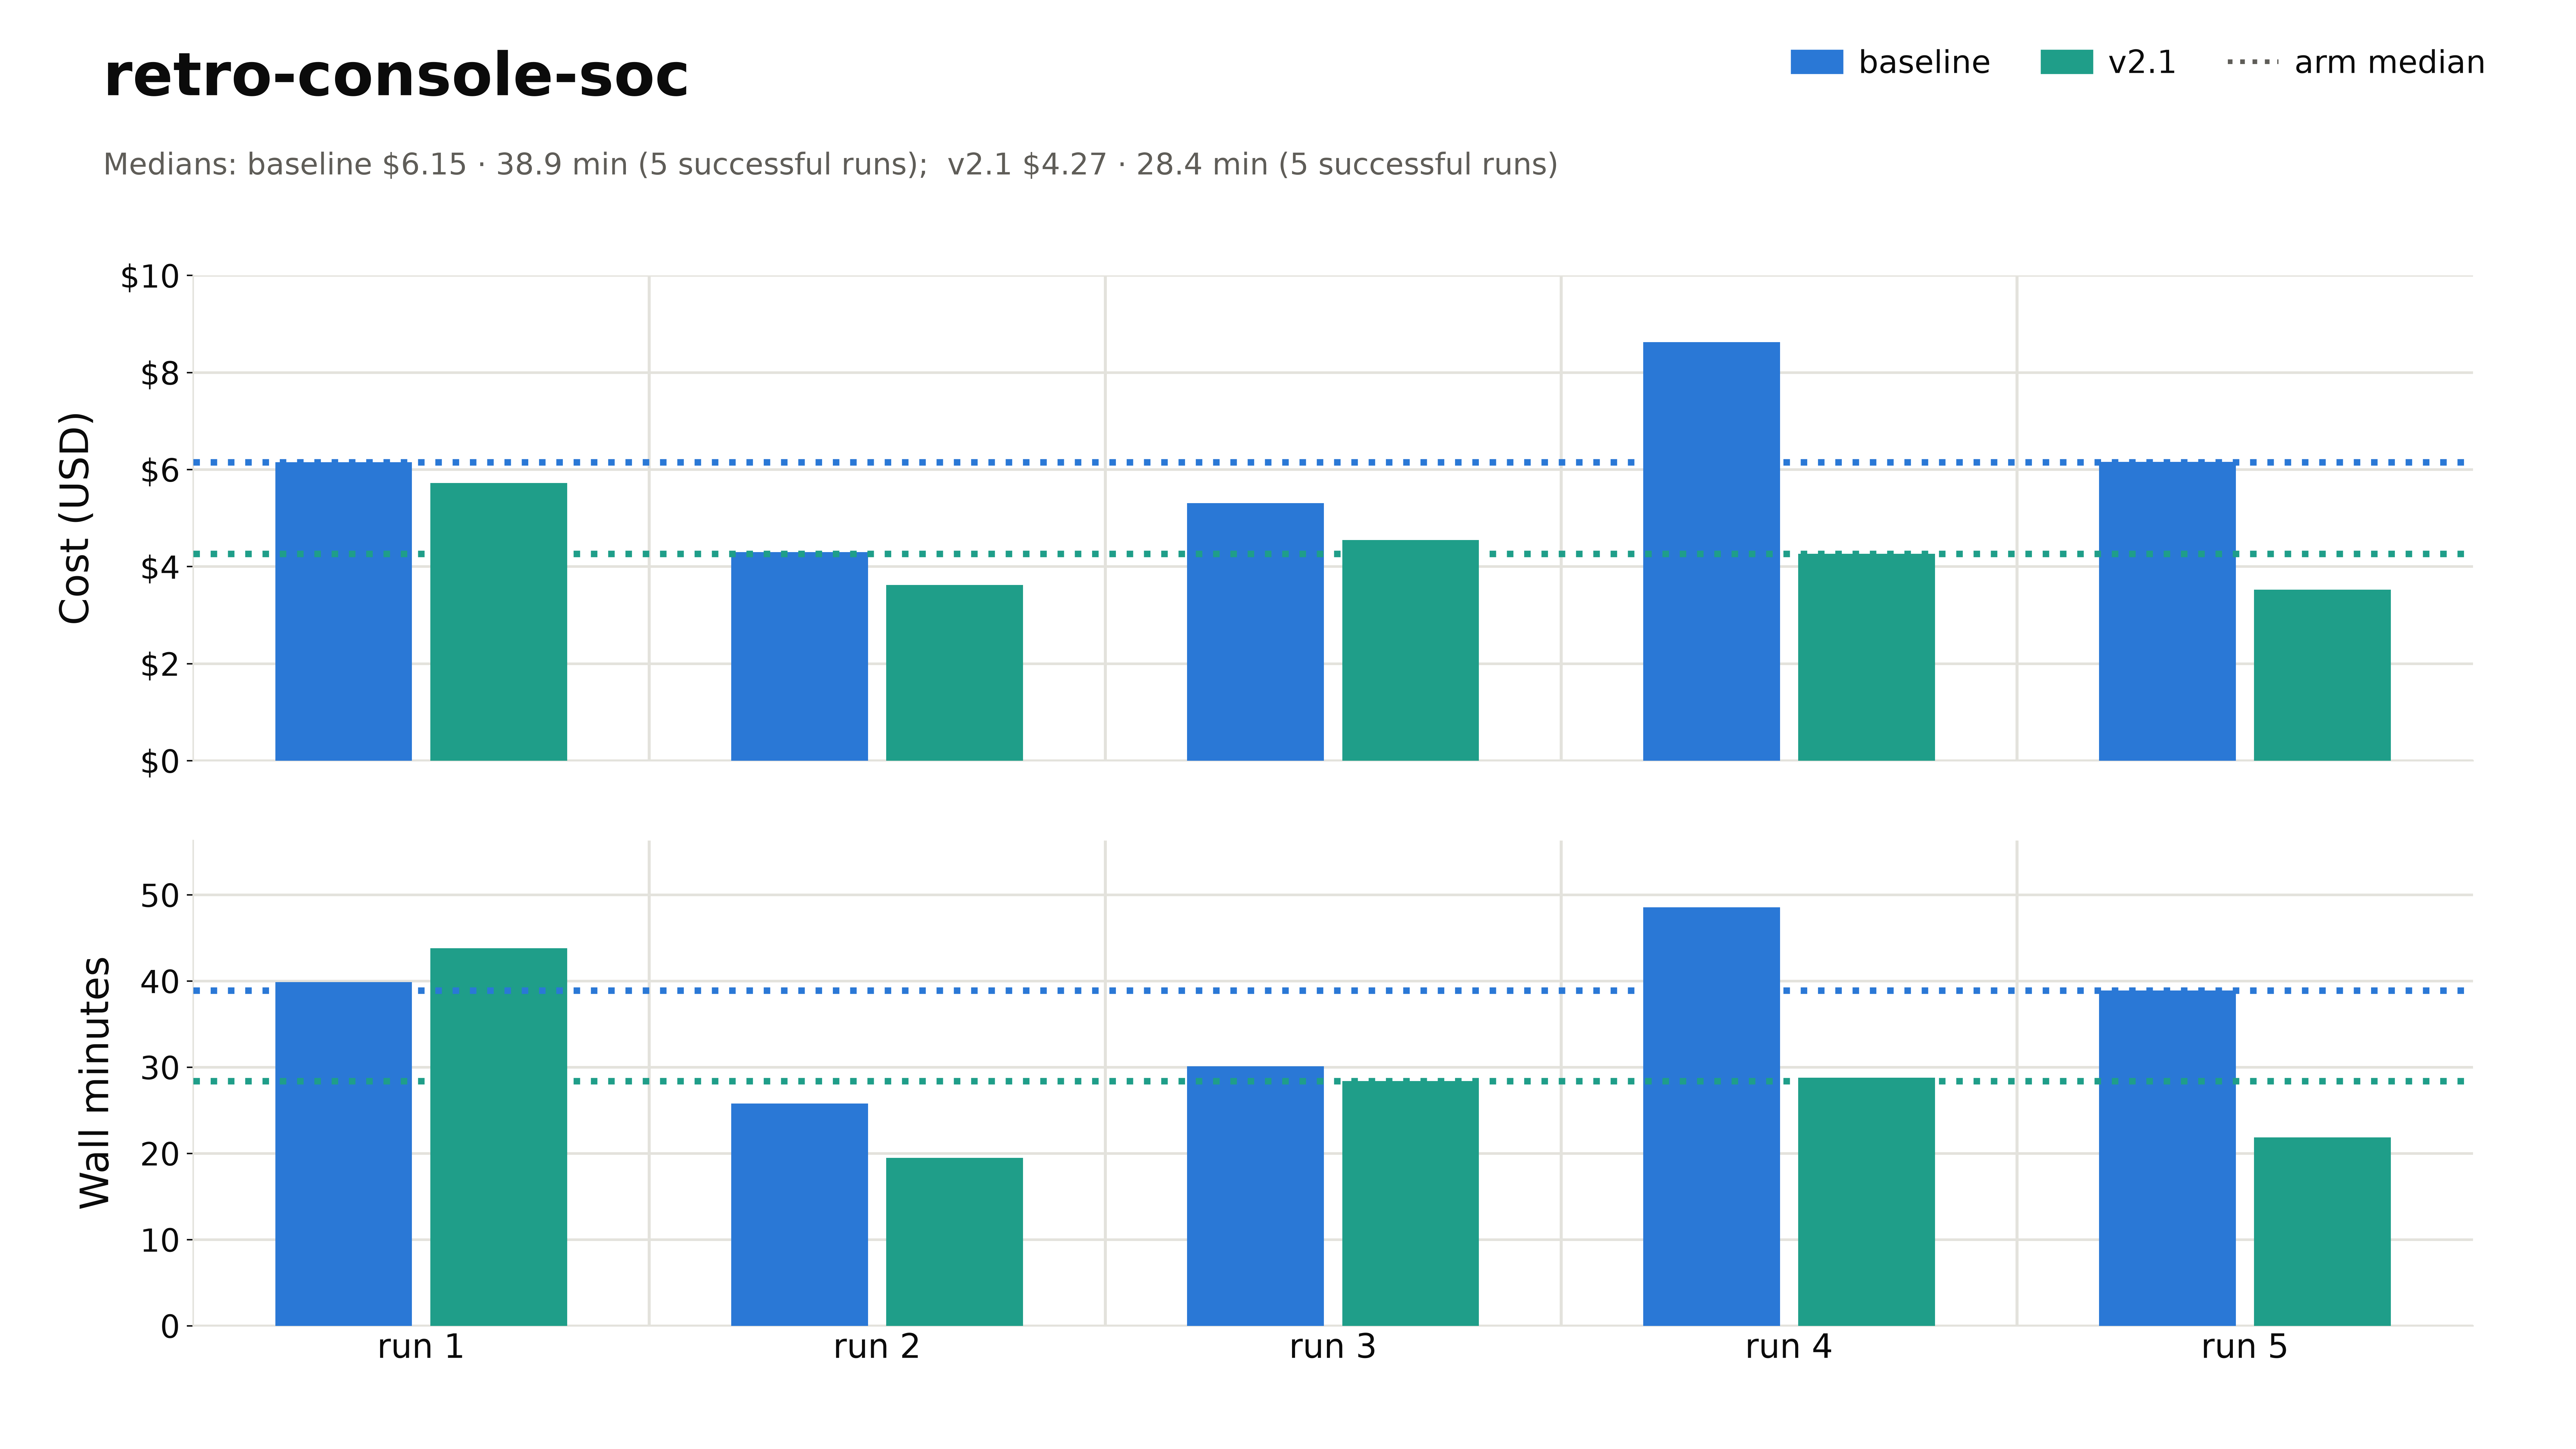
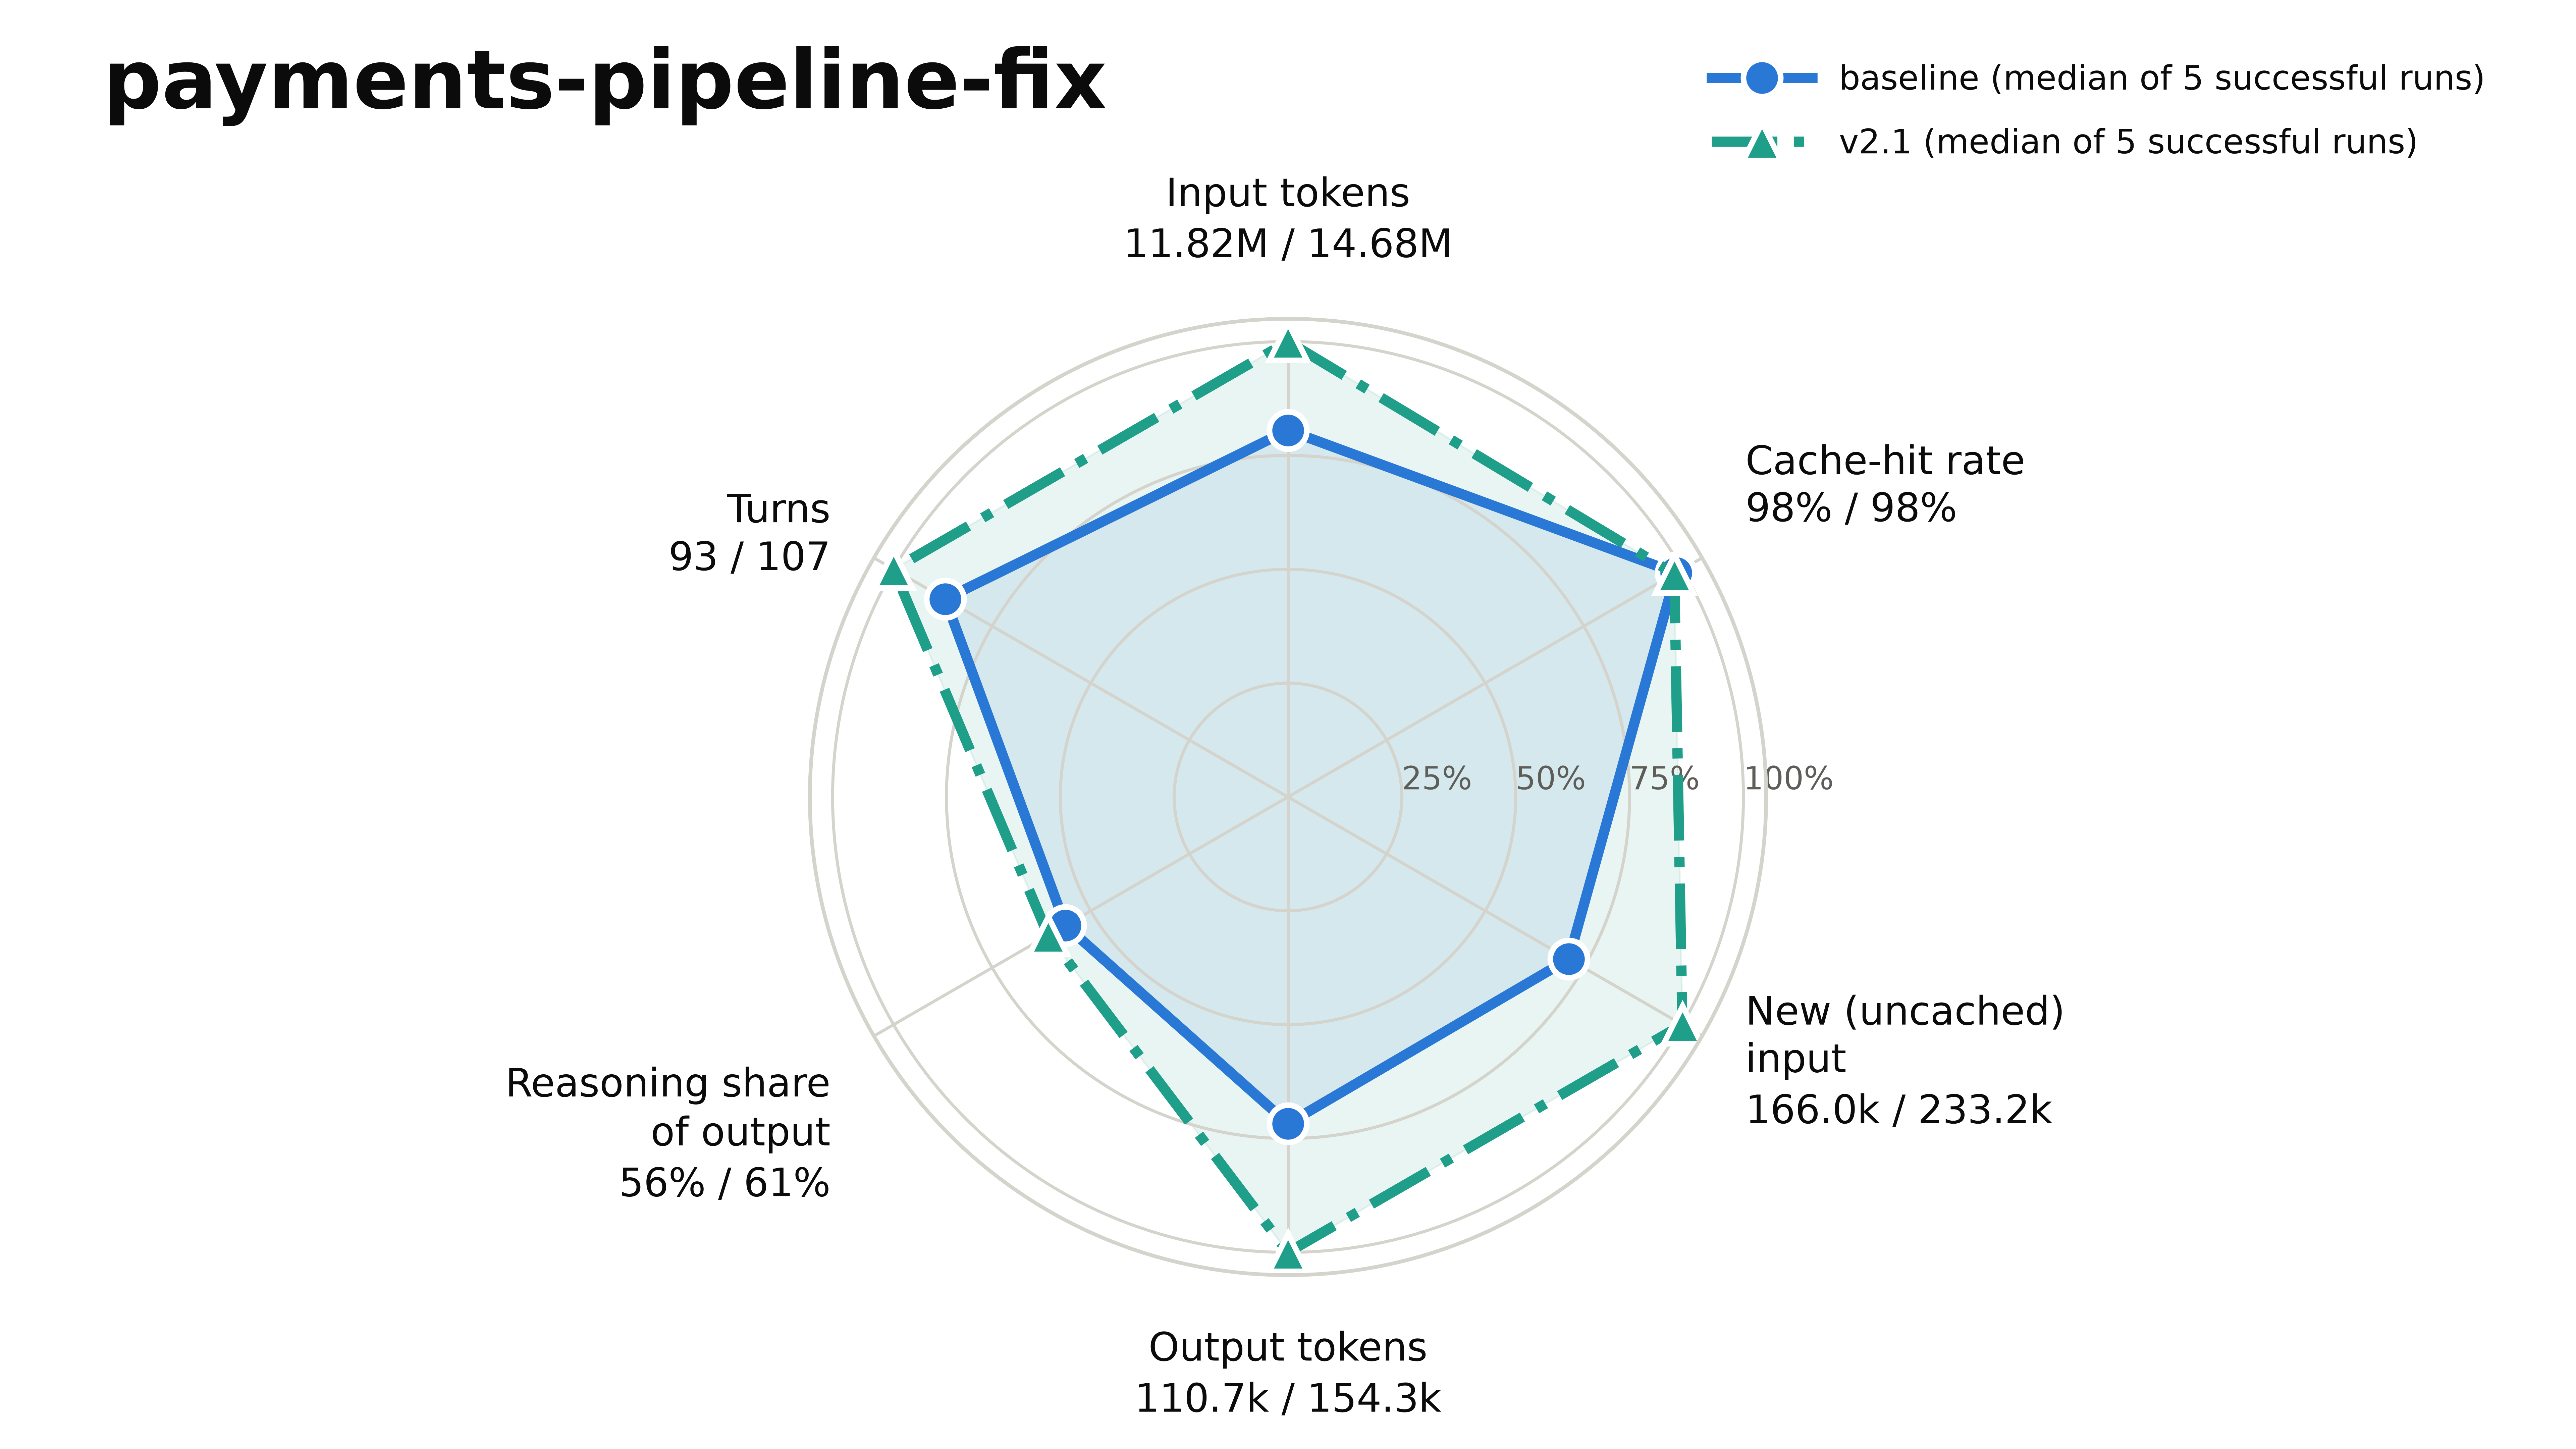
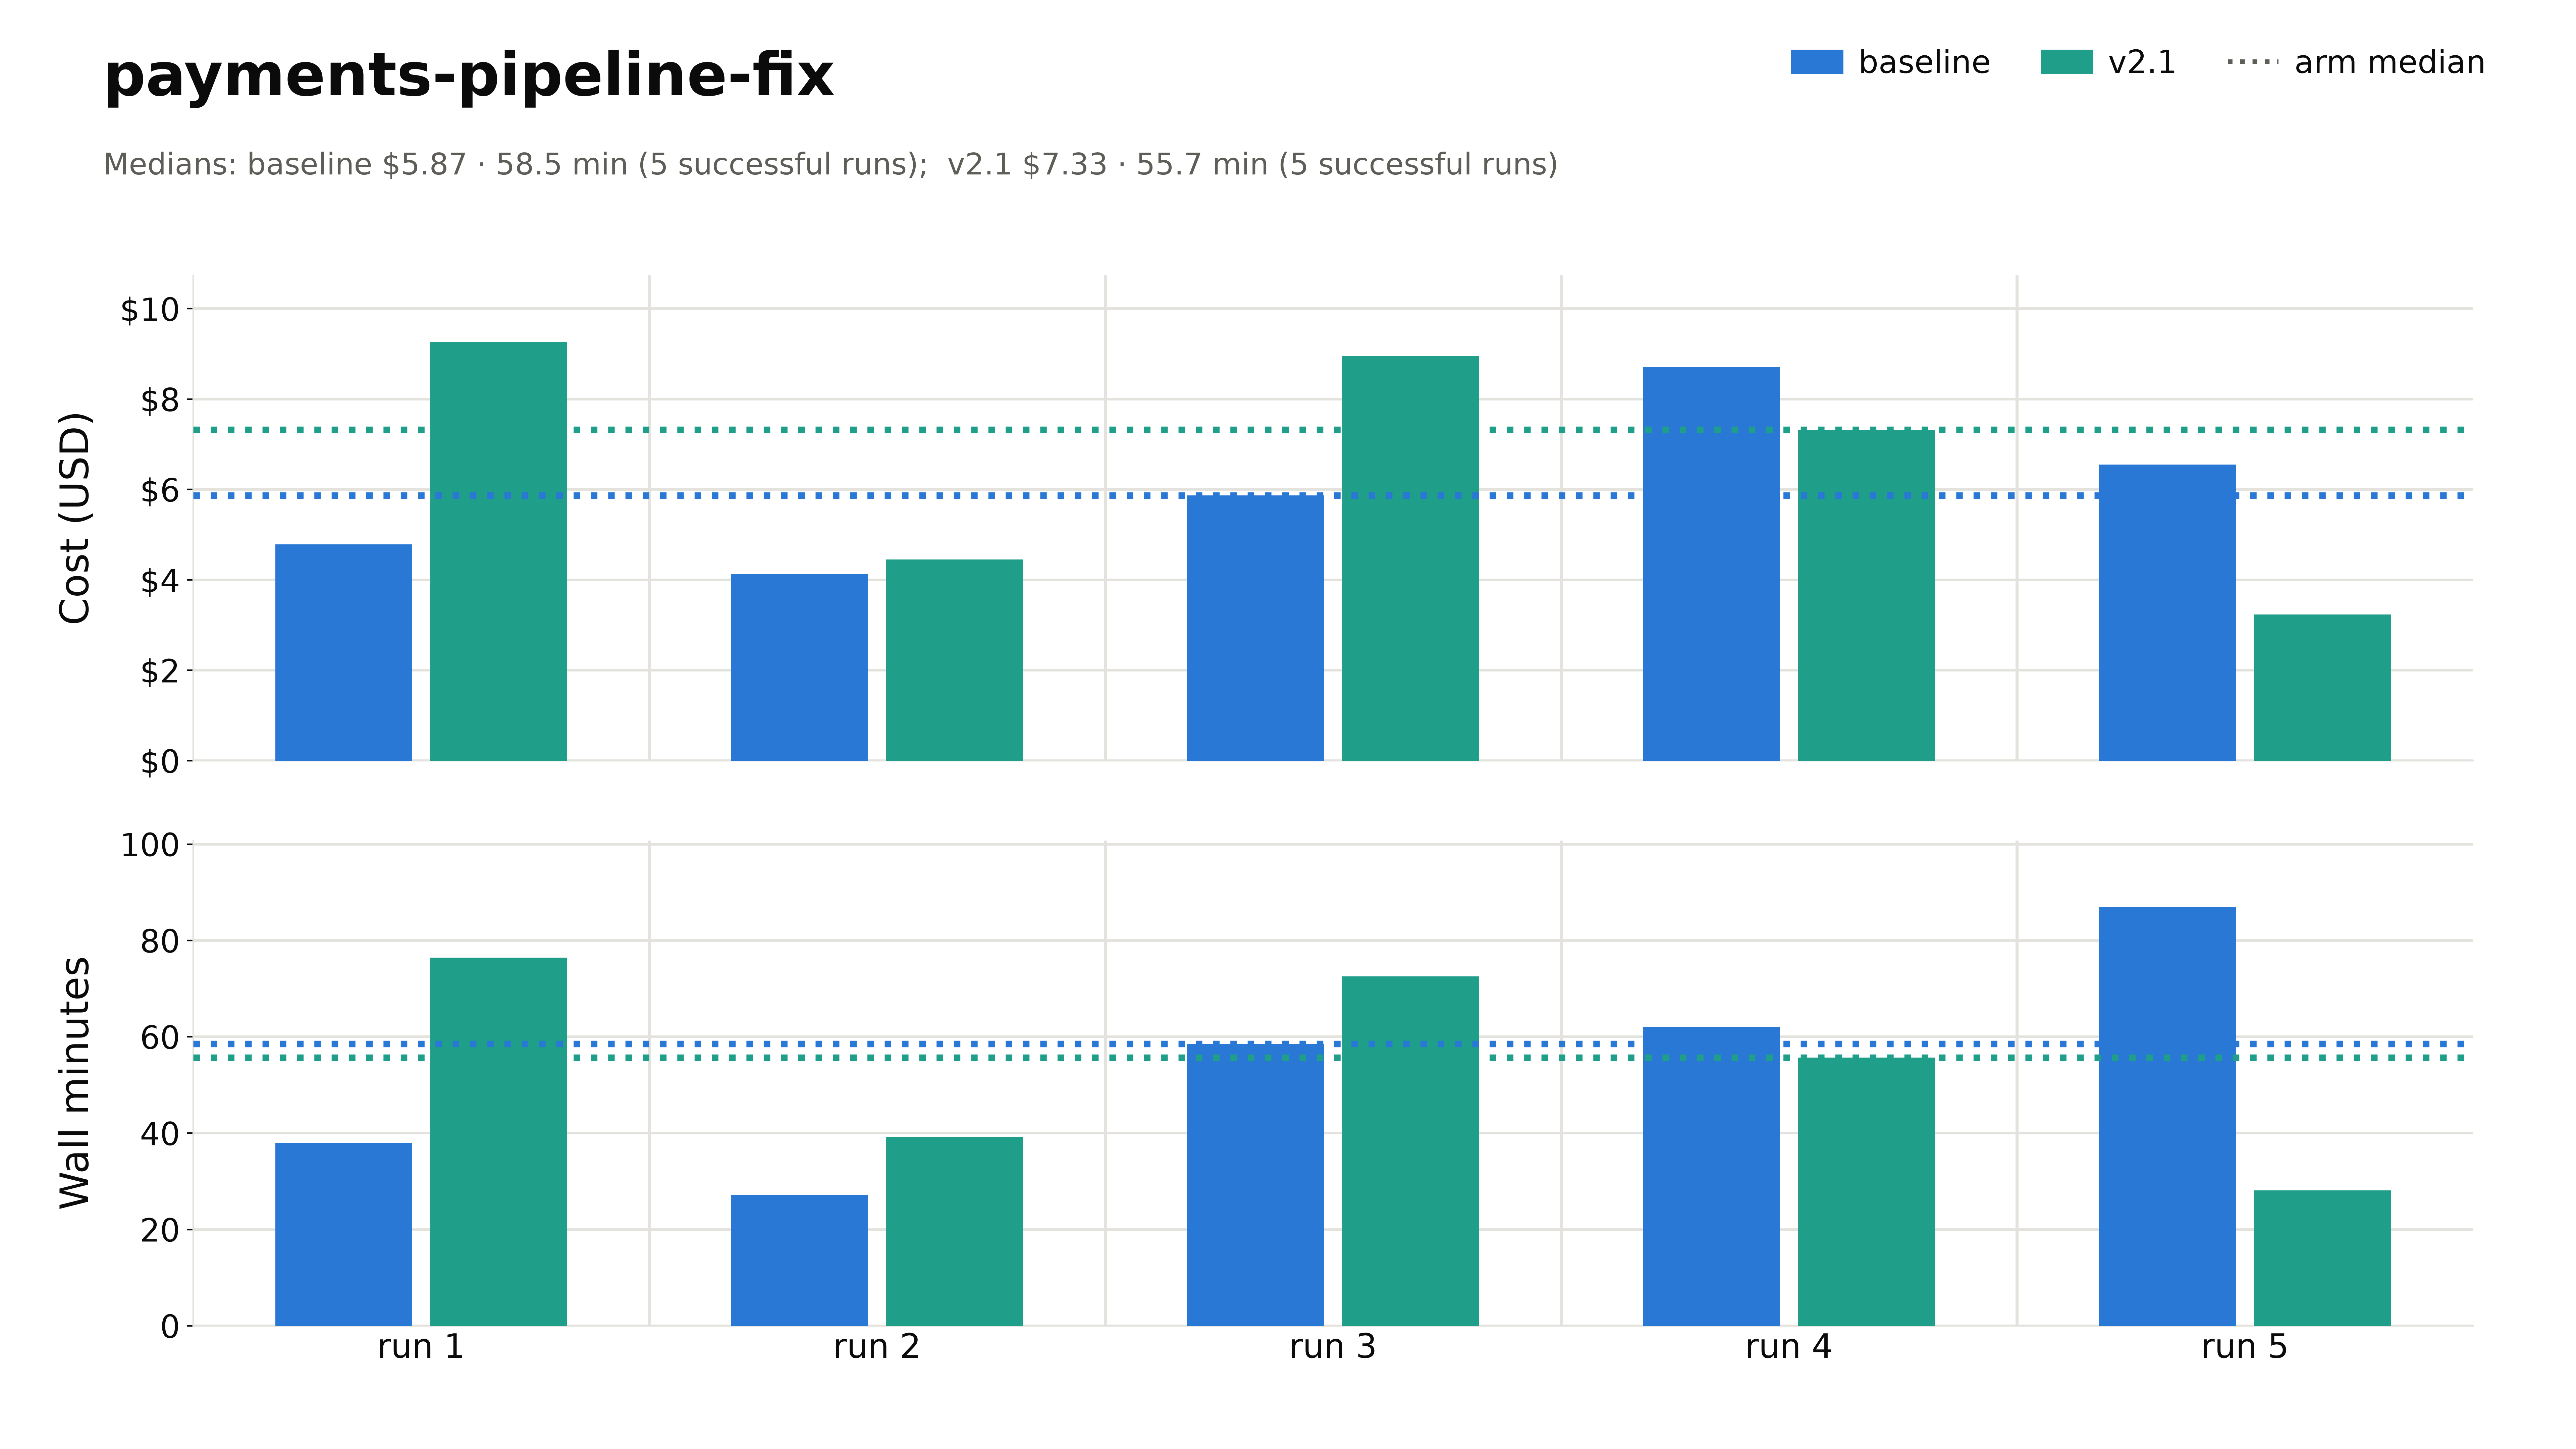
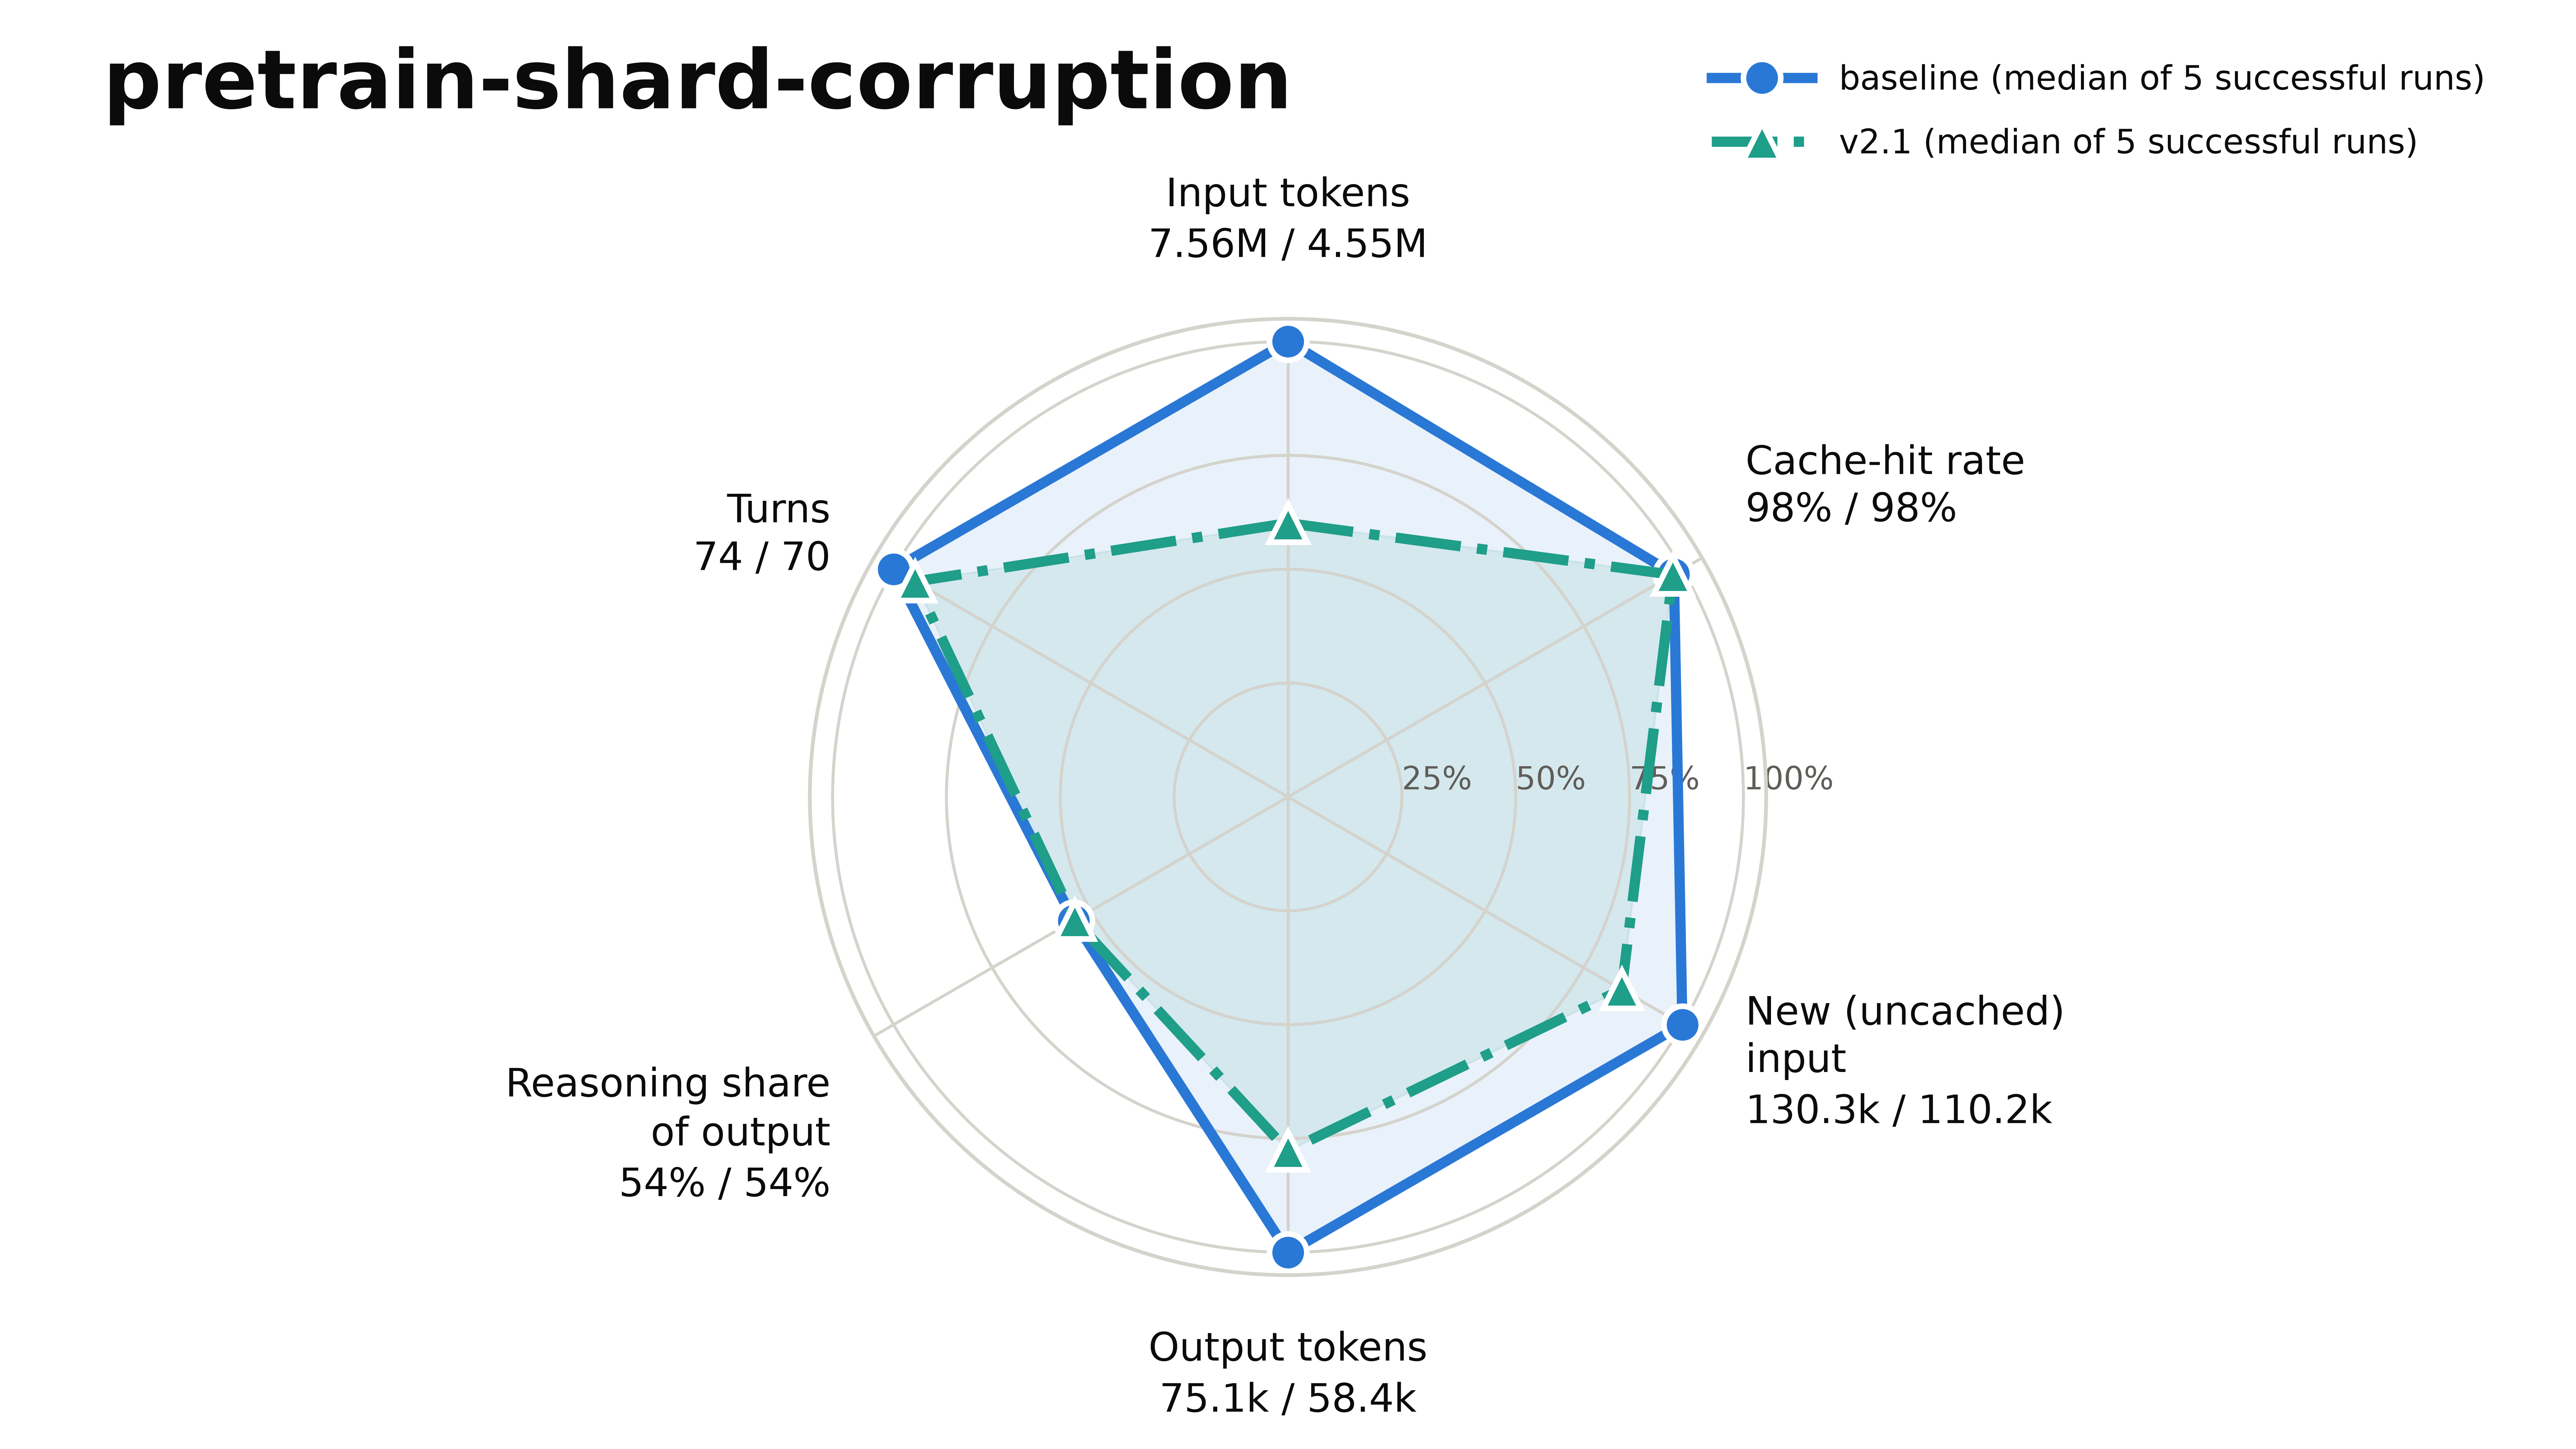
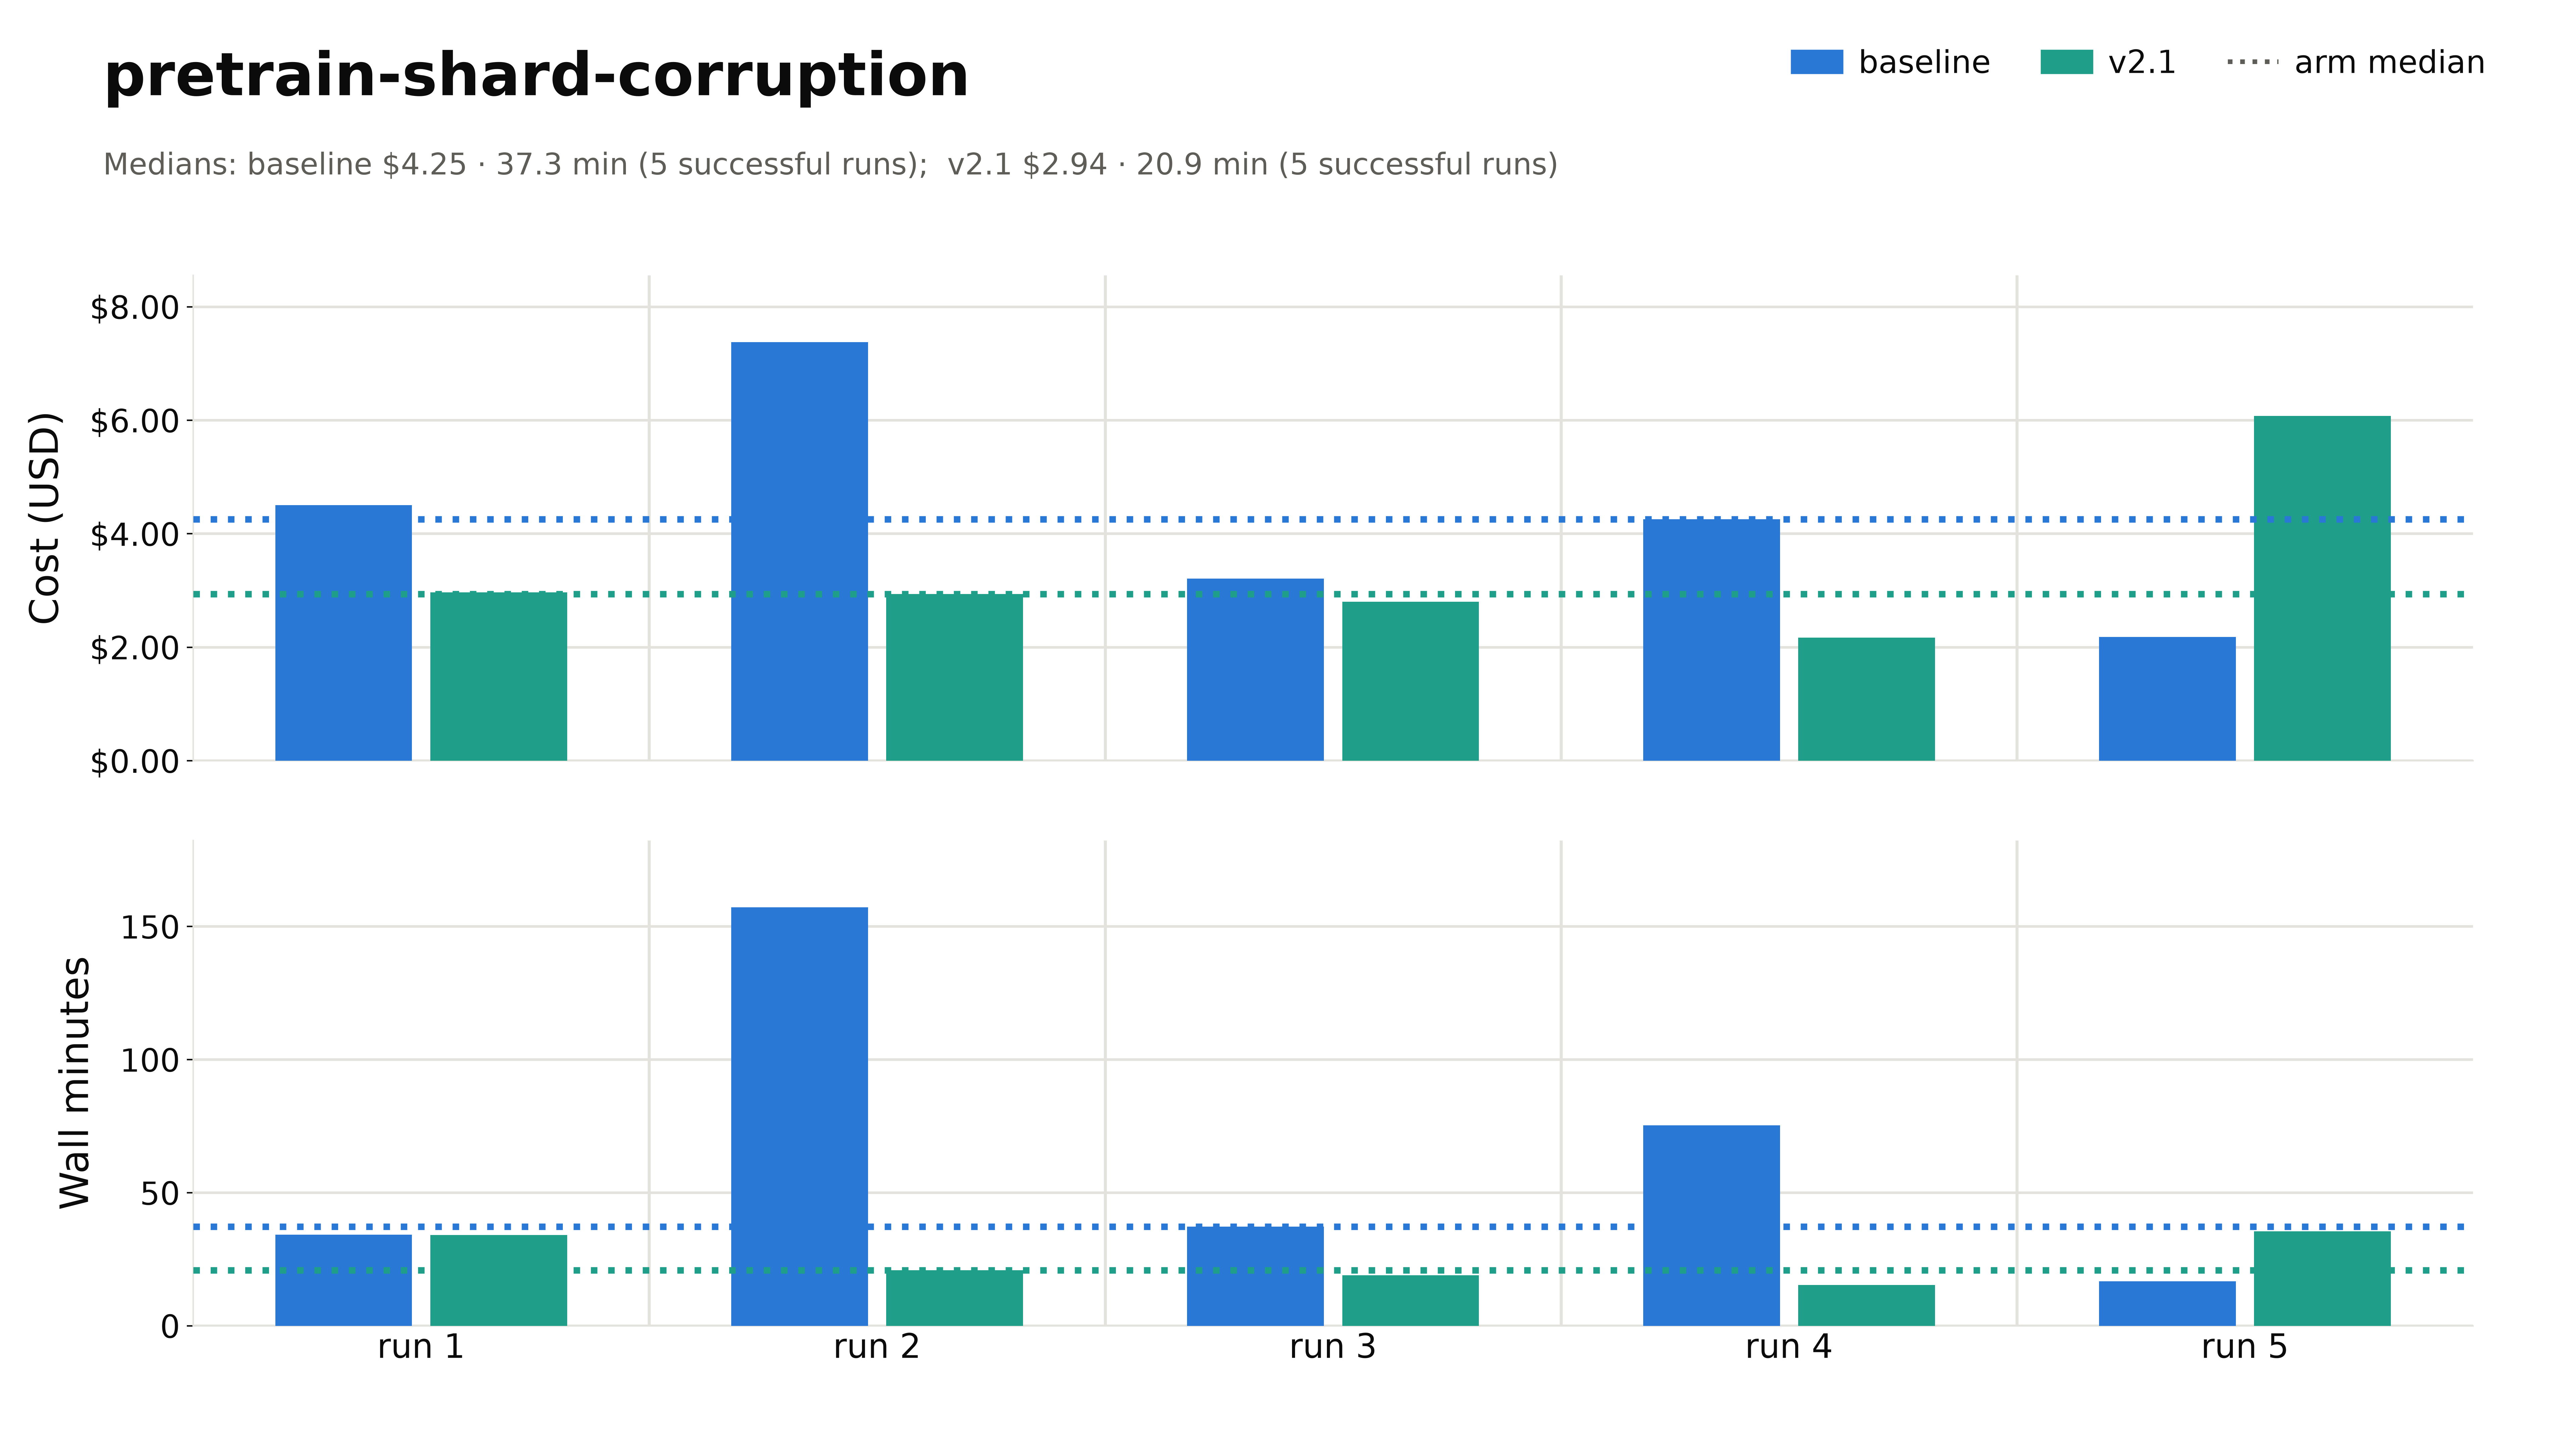
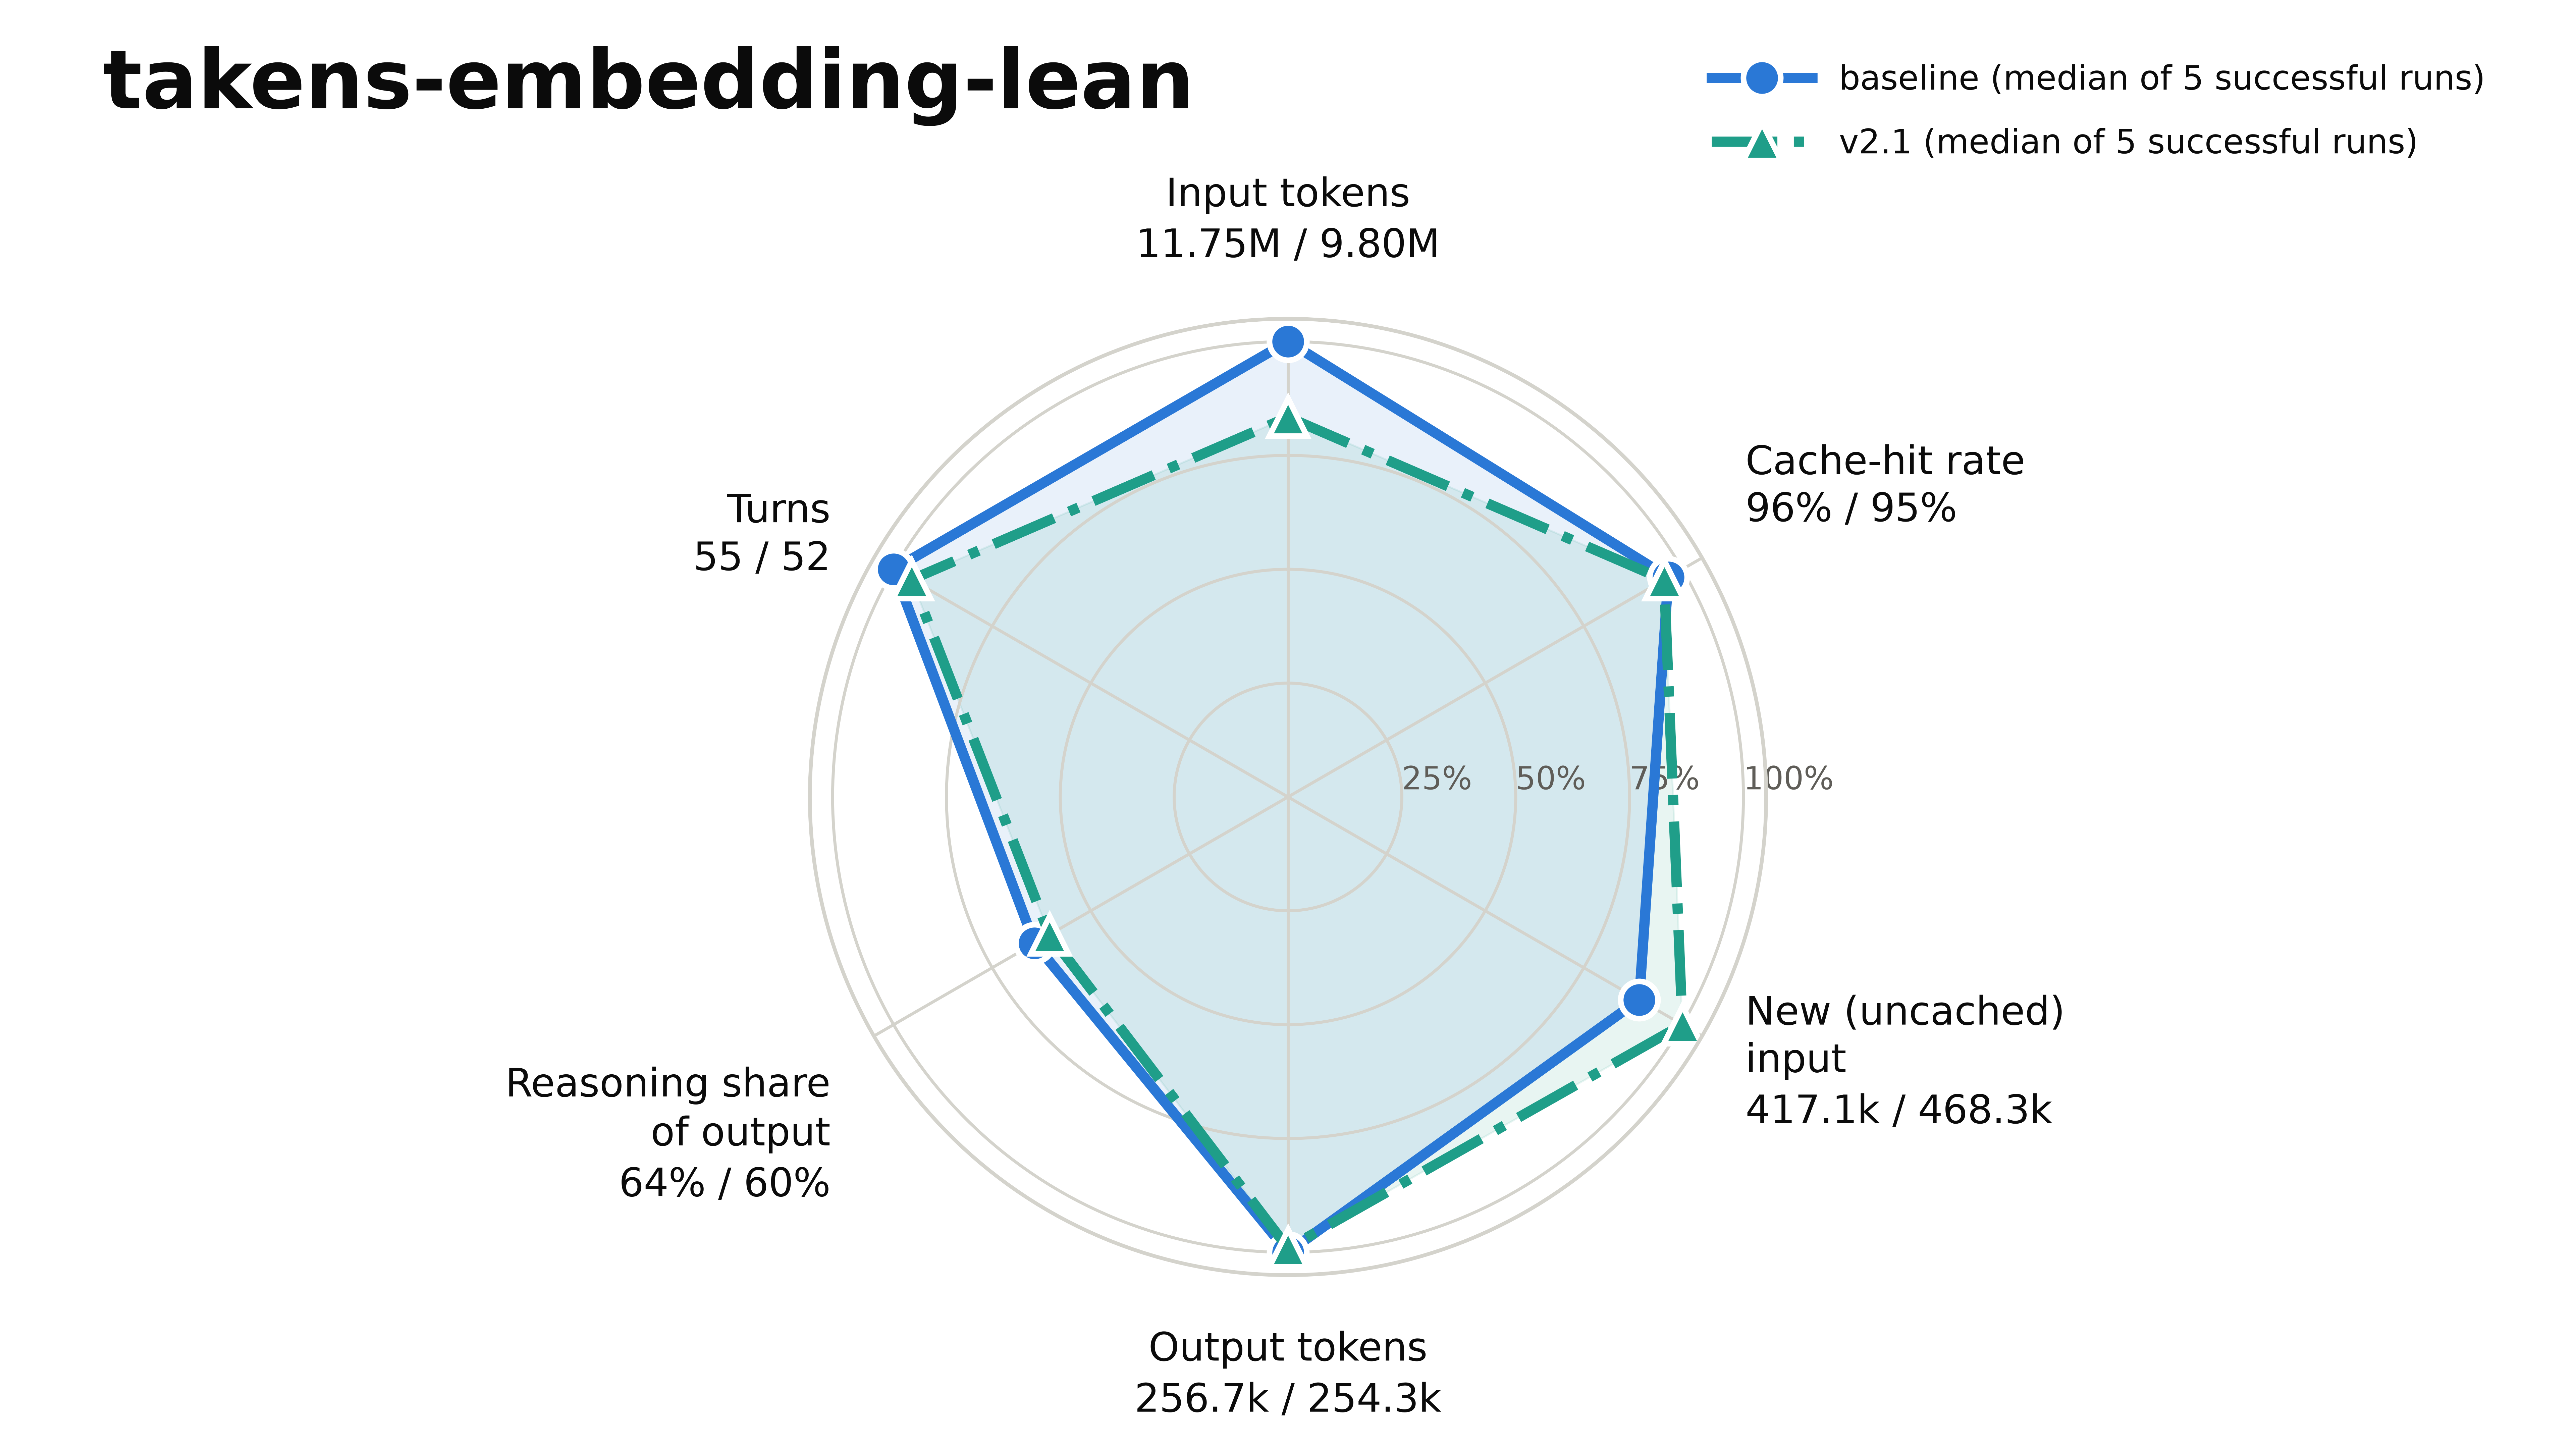
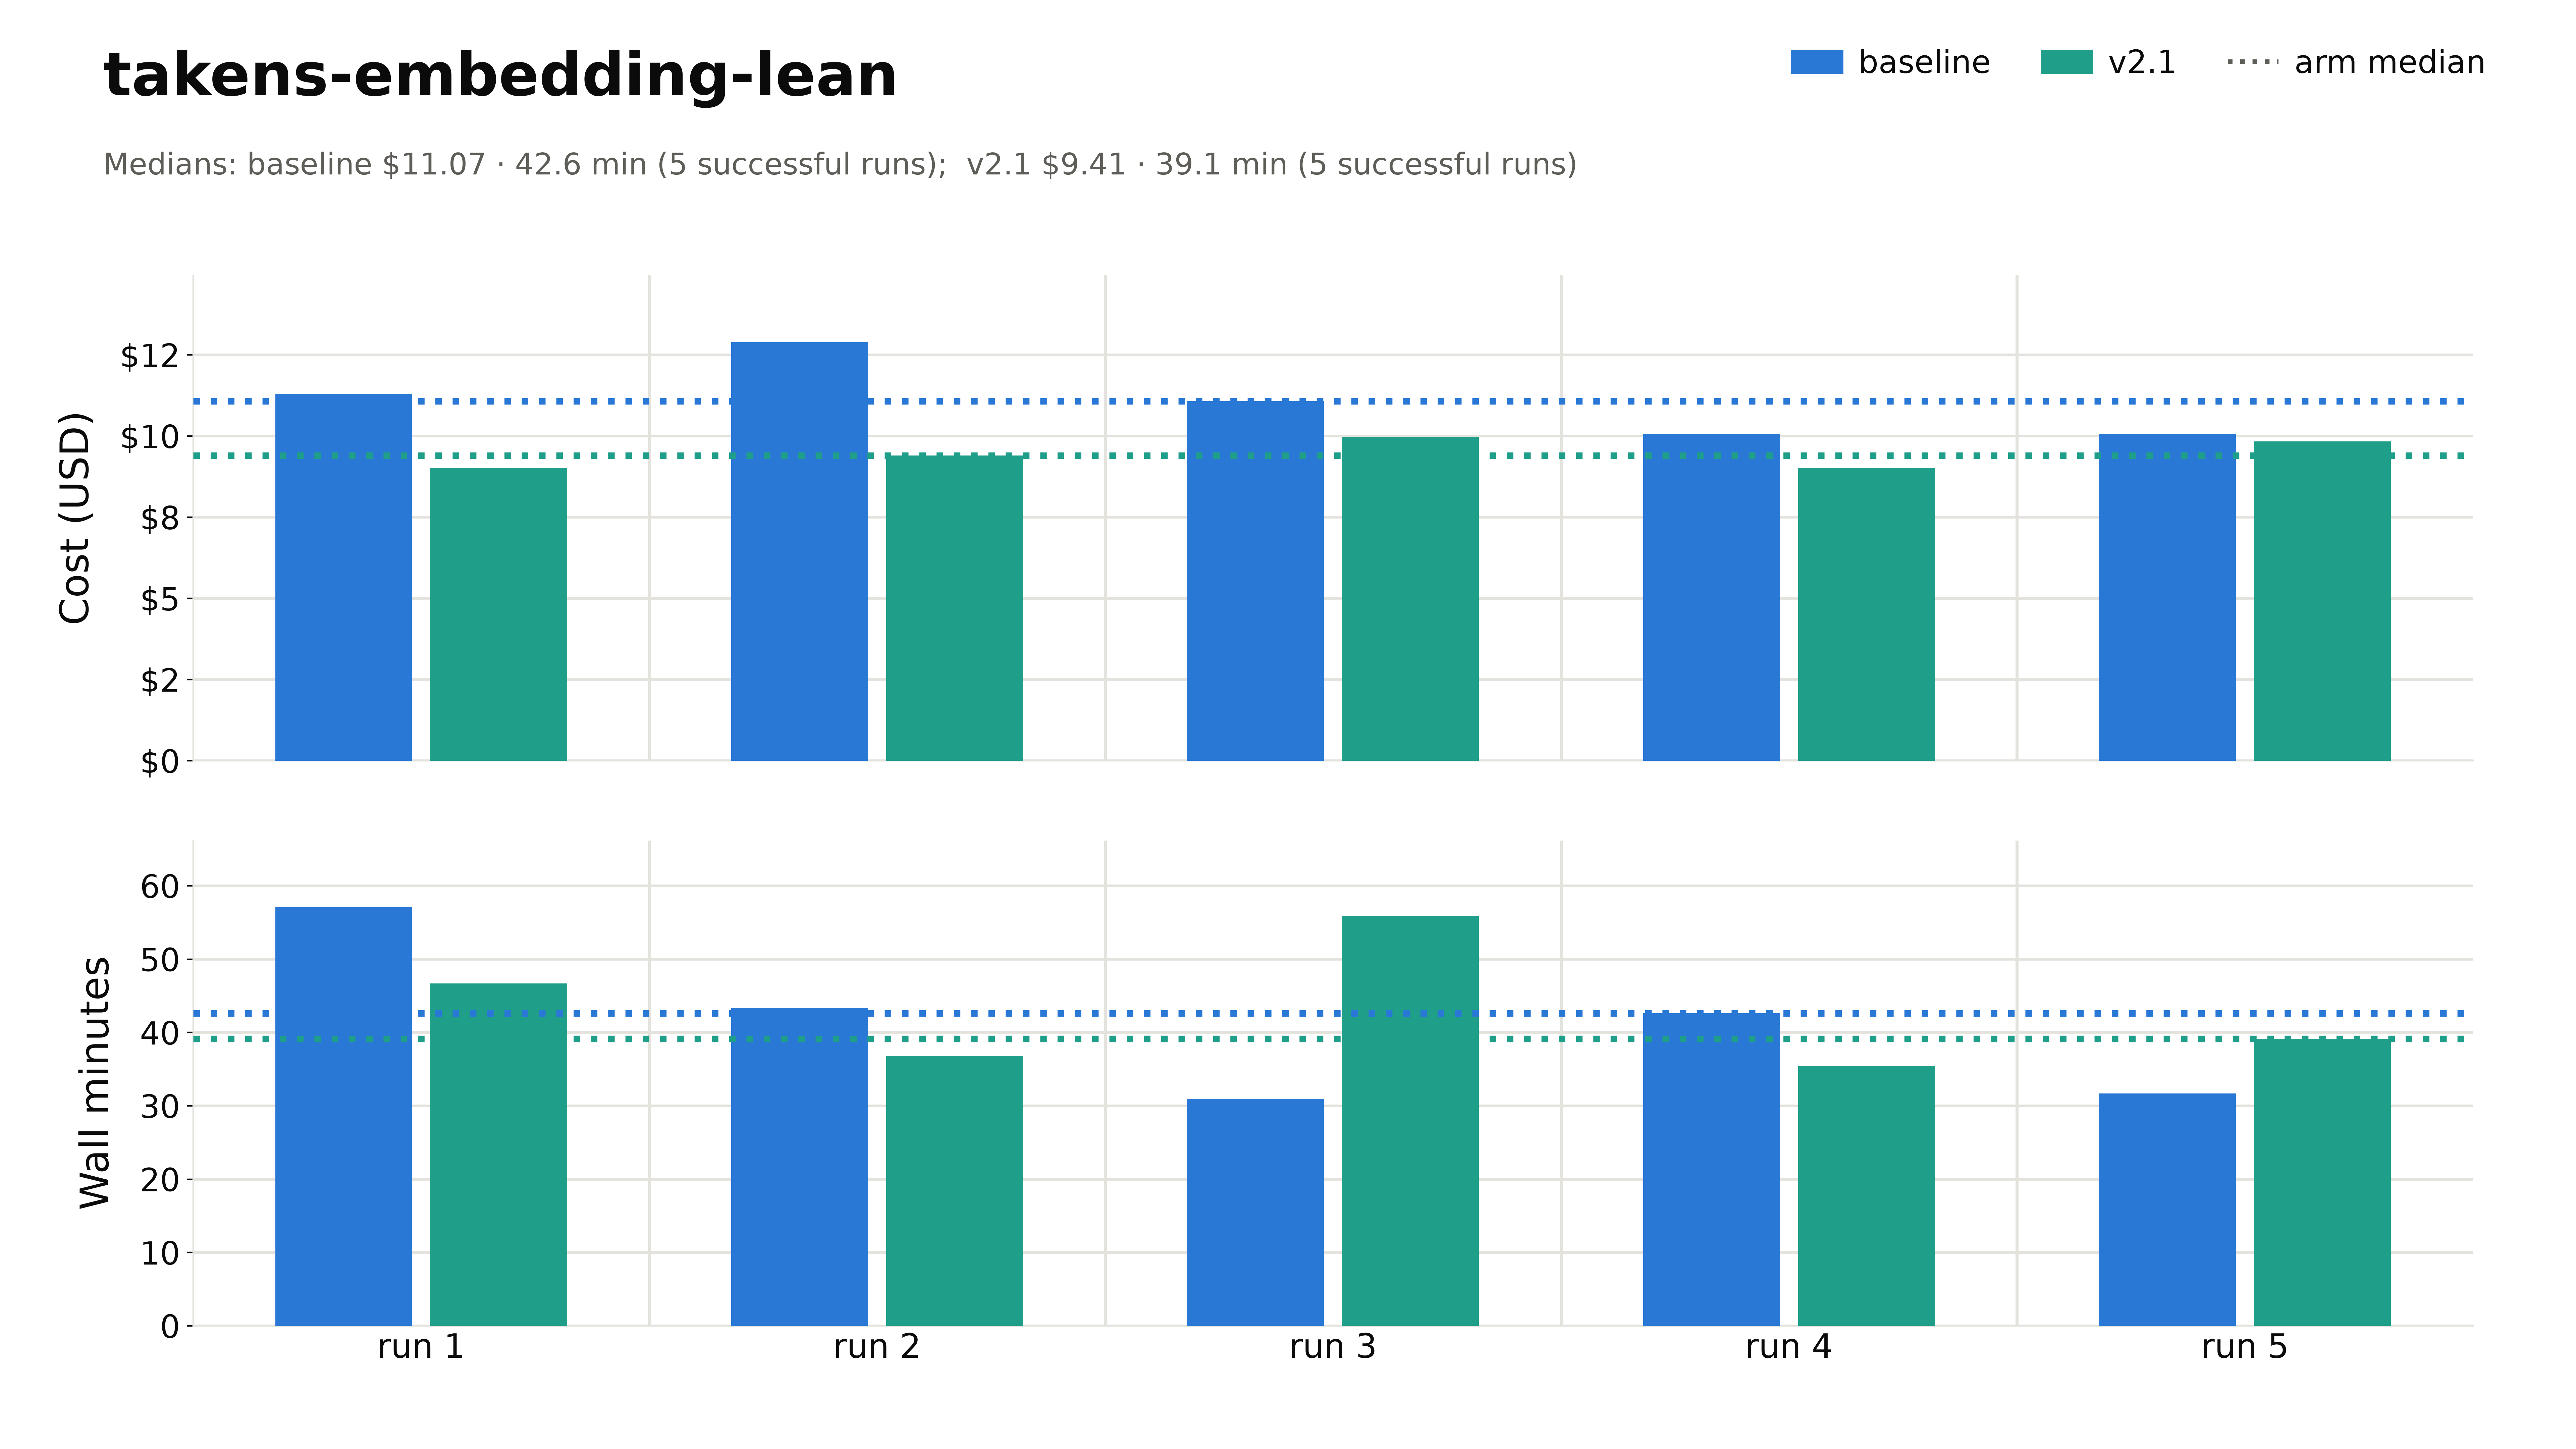
Click on a chart to zoom in.
Appendix B: v2 Deep Dive
B.1 v2 Against Baseline
| Metric | Tuning | Held-out | All |
|---|---|---|---|
| Cost | −13.2% | −18.0% | −14.6% |
| Wall time | +14.4% | −7.6% | +7.6% |
| Model time | +0.9% | −2.0% | +0.0% |
| Tool time | +38.4% | −6.3% | +23.8% |
| Input tokens | −25.3% | −39.5% | −29.7% |
| Output tokens | −0.6% | +0.5% | −0.3% |
| Turns | +3.8% | −2.7% | +1.9% |
| Requests | +8.2% | +0.1% | +5.8% |
Successful runs on the 14 majority tasks (All): the ten tuning tasks and 4 of the held-out ones. Turns are the agent’s own, as in v1; requests also count its subagents’.
- [The cache lifetime] 47 successful v2 runs used the 5-minute cache. Its 18 expiries cost $3.80 in rewrites, against $14.81 saved by cheaper writes, a net $11.01: nearly half of v2’s saving on these runs. Only
layout-config-recreation2lost money: $0.48 over 5 runs. The choice changed during the eval on 1 tuning and 2 held-out tasks, so for this setting the held-out tasks were not unseen. - [Subagents] Both arms proved lemmas in parallel subagents on
takens-embedding-lean. v2 split the work more finely (0–12 subagents per run, against 0–7). Its runs took 39.8 against 44.5 minutes, a gap within noise, at a similar cost. - [Cost and wall time move together] Across 62 matched pairs of successful runs (same task and repeat), the correlation is +0.85: where v2 was cheaper, it was also 16% faster.
B.2 Wall Time on the Tuning Tasks
Wall time on the tuning tasks rose 14.4%, not significantly against the baseline run beside it.
- [Tool time, not the model] Tool time rose 38% while model time held (+0.9%). Of the 4.3 extra minutes per run in tool calls, 2.3 went to waiting on jobs, 1.2 to running programs and 0.9 to other shell commands.
- [More computation of the agents’ own] On
layout-config-recreation2, v2’s searches ran longer. Onembedding-drift-monitor, v2’s agents ran more edit-and-check cycles, against a calibration that takes up to about 100 seconds per check. - [Two baseline samples] The earlier eval’s baseline, on the same ten tasks, gives a second baseline sample. The two samples differ by 18% in wall time, more than v2 differs from its own baseline (14%). Against both samples pooled, though, v2 was 22% slower, a gap outside noise. On three tasks, most of v2’s runs were slower than every baseline run of both evals.
- [One task carries the waiting] Over the 14 compared tasks, v2’s runs took 2.2 minutes longer than baseline’s and waited 1.6 minutes more. But on
pretrain-shard-corruptionalone, v2’s agents waited 14 more minutes per run. Without that task, waiting accounts for 0.7 of 2.0 extra minutes.
Appendix C: v2.1 Deep Dive
C.1 Each Arm Against Its Own Baseline
| Measure | v2 vs. baseline | v2.1 vs. baseline | ||||
|---|---|---|---|---|---|---|
| Tuning | Held-out | All | Tuning | Held-out | All | |
| Cost | −13.2% | −18.0% | −14.6% | −12.3% | −17.7% | −14.5% |
| Wall time | +14.4% | −7.6% | +7.6% | +1.3% | +9.1% | +4.4% |
| Model time | +0.9% | −2.0% | +0.0% | +8.1% | +5.3% | +7.0% |
| Tool time | +38.4% | −6.3% | +23.8% | −14.8% | −5.3% | −11.0% |
| Input tokens | −25.3% | −39.5% | −29.7% | −24.9% | −31.7% | −27.8% |
| Output tokens | −0.6% | +0.5% | −0.3% | +6.0% | +4.0% | +5.2% |
| Turns | +3.8% | −2.7% | +1.9% | −3.0% | +3.0% | −0.6% |
| Requests | +8.2% | +0.1% | +5.8% | −2.9% | −0.1% | −1.8% |
| First request size | −76% | −76% | −76% | −63% | −63% | −63% |
Successful runs on the majority tasks: the ten tuning tasks for both arms, plus 4 held-out tasks for v2 and 7 fresh ones for v2.1. All pools each arm’s tasks: 14 for v2 and 17 for v2.1.
The last row shows what the restored tools add. Every request carries the system prompt and a definition of each tool. v2.1 adds three: Monitor’s description is a usage guide of over 5,000 characters with shell examples, ReadNotifications’ about 1,900 characters and TaskStop’s about 360. Together, the three definitions add 3.9K tokens to every request. v2.1’s first request is 11.3K tokens, against v2’s 7.4K and baseline’s 30.8K (30.7K on the tuning tasks). So v2.1’s first request is 63% smaller than baseline’s, where v2’s was 76% smaller. The same cache-lifetime procedure, drawing on more earlier runs by then, chose a different mix of lifetimes on 2 of the 10 tuning tasks.
C.2 Waiting on the Tuning Tasks
Each arm beside the baseline that ran alongside it, on the successful runs. Per-run figures are averaged within each task, then over the ten tasks.
| Measure | v2 eval | v2.1’s comparison | ||
|---|---|---|---|---|
| Baseline | v2 | Baseline | v2.1 | |
| Foreground polling, minutes | 1.5 | 4.7 | 3.7 | 4.1 |
| Share of it on processes the agents had detached | 77% | 54% | 66% | 57% |
| Sleep-guard blocks followed by a foreground poll | 1 of 17 | 10 of 21 | 7 of 21 | 2 of 13 |
Sleep-guard blocks followed by a Monitor watch | 1 of 17 | – | 1 of 21 | 6 of 13 |
| Share of background-job time worked alongside | 62% | 47% | 51% | 55% |
| Runs with a turn ended to wait for a notice | 5 of 47 | 1 of 49 | 6 of 50 | 0 of 50 |
| Idle until a notice, minutes | 0.34 | 0.18 | 0.54 | 0.00 |
Monitor watches | 0.26 | – | 0.30 | 0.42 |
TaskStop calls | 0.04 | – | 0.00 | 0.22 |
A dash marks a tool the arm did not offer. Detached processes were started with nohup or & and left running (Appendix C.3). After a sleep-guard block, the rows count the agent’s next waiting move.
- [Where v2 polled most] On
pretrain-shard-corruption, every v2 run polled for 17 to 53 minutes, and v2.1’s for 0 to 14 (median 1). v2.1’s agents watched their jobs withMonitorin 4 of 5 runs; each baseline’s agents did so in at most 2. v2.1’s agents also detached fewer processes: a median of 0 per run, against v2’s 3 and the baselines’ 2 and 4. And v2.1’s runs were the shortest of any arm’s, a median of 21 minutes against 37 to 62. Both gaps, in polling and in run time, are statistically significant against v2 (two-sided exact Mann-Whitney test). With five runs per arm, neither gap is significant against v2.1’s own baseline, whose runs polled a median of 2 minutes but up to 66. The task was singled out because v2 polled most there, so part of the gap against v2 may be regression to the mean. - [Where v2.1 polled most] Over the ten tasks, v2.1 polled about as long as v2: 4.1 against 4.7 minutes per run. Most of v2.1’s polling was on
layout-config-recreation2. There, v2.1 polled 29.5 minutes per run against baseline’s 3.6, in three runs whose loops held the main thread for 92, 30 and 25 minutes. 78 of those 92 minutes waited on processes the agent had detached. - [The two baselines] Against its own baseline, v2.1 looks far better than v2 did: v2.1’s runs took 1% longer, where v2’s took 14% longer. But that is mostly because v2.1’s baseline polled more and ran longer than v2’s. The baseline beside v2.1 polled 3.7 minutes per run, against 1.5 for the one beside v2. Two of its runs, on
pretrain-shard-corruption, hold 110 of its 183 polling minutes. Neither difference between the baselines is statistically significant. The two arms’ changes in wall time differ in tool time, not model time: tool time rose 38.4% for v2 and fell 14.8% for v2.1. Of the 7.0 minutes per run between the two changes in wall time, 4.2 are the difference between the baselines (on the runs whose tool time is known). The gap between the two changes is not statistically significant. - [v2.1 against v2, the baselines factored out] v2.1 can be compared with v2 in two ways. Directly, v2.1’s runs are set against v2’s, as if the two evals had run under the same conditions. Each against its own baseline, v2.1’s change from its baseline is set against v2’s change from its own. This difference in differences puts any gap between the baselines down to the conditions of each eval. Both comparisons point the same way:
| Measure | v2.1 vs. v2 | Baselines | |
|---|---|---|---|
| Directly | Each against its own baseline | v2.1’s against v2’s | |
| Wall time | −5.4% | −11.4% | +8.8% |
| Tool time | −34.5% | −38.4% | +11.2% |
| Model time | +5.9% | +7.2% | +0.1% |
| Cost | +5.6% | +1.0% | +0.6% |
| Foreground polling, minutes per run | −0.6 | −2.8 | +2.2 |
The study’s estimator, with a 95% hierarchical bootstrap; polling, which is often zero, as a difference of task means. None of these differences is statistically significant. Without pretrain-shard-corruption, v2.1 polled more than v2: 2.5 minutes per run more directly, and 1.4 more against the baselines.
- [Turns ended to wait] Three of the six baseline runs that went idle did so while their subagents worked on
takens-embedding-lean. On that task, v2.1’s agents ran subagents in all five runs but never went idle while one ran. - [Watches] v2.1’s agents started their 21
Monitorwatches in 10 of their 50 runs. They polled in the foreground during 11 of the 21 watches, and went idle during none. Baseline’s agents started 15 watches in 5 runs and polled during 2 of them. They went idle during 5, but the watch’s own notices woke them during only one; during the other four, another job’s notice did.
C.3 Jobs Claude Code Cannot See
A Bash command can leave a process running after the command returns: with nohup, or with an & that no later wait waits for. We call such a process detached. Claude Code tracks the background jobs it starts itself, but not detached processes. So no notice reports a detached process’s end. The agent learns of that end only by checking, in a polling loop or with a Monitor watch on the process’s output. On the tuning tasks, detached processes held most of every arm’s foreground polling: 77% of baseline’s and 54% of v2’s in the v2 eval, and 66% of baseline’s and 57% of v2.1’s in v2.1’s comparison. These shares count polling that began while no job that Claude Code tracks was running; in runs that detached nothing, such polling was half a minute or less.
C.4 Waiting on the Fresh Tasks
On the 7 fresh majority tasks, neither arm started a Monitor watch in a successful run. Foreground polling stayed under half a minute per run, so the tools had little to fix there. v2.1’s small rise, from baseline’s 0.03 to 0.38 minutes per run, was statistically significant. The requests that wait on jobs were 0.51 and 0.52 per run, and wall time (+9.1%) did not change significantly.
C.5 The Waiting Probe
To separate the tools from the work, each arm got one short job to wait for: run a 4-minute training script and report its final loss, 5 runs per arm. All 15 runs passed, and no run in any arm polled or started a watch. All five v2.1 runs started the job in the background, went idle and were woken by the job’s completion notice. Four baseline and two v2 runs did the same; the rest ran the job in the foreground. So v2.1’s tools do not stop agents from waiting for a notice. A short job whose length can be read from its script says little, though, about how agents wait on long searches whose progress they want to watch.
C.6 Single Runs Are Noisy
On the tuning tasks, v2.1’s median run used fewer input tokens than baseline’s on 8 of the 10 tasks, but was cheaper on only 6 and faster on 4. On a typical task, an arm’s slowest run took about twice as long as its fastest, and up to 9.4 times as long. Appendix A charts every run.
Appendix D: The Tools
The tools the three arms offered for running and waiting, as Claude Code 2.1.296 defines them; the linked tools reference describes the current version. Baseline offered 39 tools in all; v2 kept five; v2.1 added three back.
| Tool | Offered in | What it does and how it works |
|---|---|---|
Bash | all arms | Runs a shell command; here, every command ran inside the task’s container. A call waits 2 minutes by default, or as long as the agent sets, up to 10. A command still running at its timeout is moved to the background, not killed: Claude Code returns an ID and an output file, sends a notice when the command ends, and stops it if it is still running 10 minutes later. With run_in_background, a command starts in the background at once and may run for 10 minutes by default, or up to 2 hours if the agent asks. |
Read, Edit, Write | all arms | Read a file or a range of its lines; replace an exact string in a file; write a whole file. |
Agent (listed as Task in the session’s tools) | all arms; v2 and v2.1 allow only the general-purpose type | Starts a subagent with its own context and a task prompt. The subagent works with its own tools, and only its final report enters its parent’s context. It runs in the background by default, and a notice reports its completion. |
Monitor | baseline (deferred), v2.1 | Starts a watch: runs a shell command in the background, and each line the command prints arrives as a notice (lines within 200 ms as one). The watch ends when the command exits, when TaskStop stops it, when it prints too many lines, or at a deadline the agent sets: 5 minutes by default and, as its description says, at most 10, even when an agent asked for 60. Its result says: “You will be notified on each event. Keep working — do not poll or sleep. Events may arrive while you are waiting for the user — an event is not their reply.” Its description reserves it for one notice per occurrence, as in tail -f /var/log/app.log | grep --line-buffered "ERROR", and for a single “it’s done” points to Bash’s run_in_background with an until loop instead. |
TaskStop | baseline, v2.1 | Stops a running background task, such as a Bash job, a watch or a background subagent, by its ID. |
ReadNotifications | baseline, v2.1 | Reads the notifications queued for the session, such as GitHub activity on subscribed pull requests, scheduled triggers and messages from other Claude sessions, and marks them delivered. It never carries job or watch notices; in these runs it always returned “No queued notifications.” Not in the public tools reference. |
ToolSearch | baseline | Baseline names many tools without their definitions (deferred tools), and ToolSearch loads a definition into the conversation. A deferred tool called before it is loaded fails: 4 of the 18 Monitor calls in baseline’s successful runs of the v2 eval did. v2 and v2.1 defer nothing, so every definition is in the prompt from the first request. |
| The sleep guard (not a tool) | all arms | Claude Code blocks a foreground Bash call that starts with a sleep of 25 seconds or more, and replies: “To wait for a condition, use Monitor with an until-loop … To wait for a command you started, use run_in_background: true. Do not chain shorter sleeps to work around this block.” It names Monitor even where Monitor is not offered, as in v2. |
Appendix E: Failed Runs
On the majority tasks, 12 of the 310 runs failed, and none was traced to the harness:
| Eval | Tasks | Failed runs | |
|---|---|---|---|
| Baseline | v2 or v2.1 | ||
| v2 eval | Tuning | 3 of 50 | 1 of 50 |
| Held-out | 2 of 20 | 0 of 20 | |
| v2.1 | Tuning | 0 of 50 | 0 of 50 |
| Fresh held-out | 3 of 35 | 3 of 35 | |
Failed runs among all runs on the majority tasks.
No failed run timed out, was resumed or ended in an error, and each used only tools that both arms have. Read against the tasks’ tests, all but one failure came down to the agent’s own choices on that run:
- [Checks that could not see the fault] In eight runs, the agent’s own checks passed where the tests failed. Some were slips in building, such as a CAD slot cut through both walls. Others were cases left untested, such as a slow API never measured or a short input never tried.
- [A fault seen, and kept] In three runs, the agent saw evidence against its answer and submitted it unchanged. One agent kept a transaction code in a trade-statistics declaration after reading that the code did not fit. Another kept log-scaled input to a gene-set analysis after seeing that the scale changed which groups were called. A third left out of its own tests the records that broke its design, records its own test simulator had written into the live data.
- [Cut off] Once, the agent stopped after a safety classifier cut off a response.
Why, then, did v2 fail less often than its baseline, 1 run against 5? The counts are consistent with chance. Baseline Claude Code itself failed 3 of its 50 runs on the tuning tasks in the v2 eval, and none of its 50 in v2.1’s comparison. And even if both arms failed equally often, a split as uneven as 5 to 1 would happen about one time in five.
Appendix F: Six Revised Findings
Six findings, each already reported, were revised: the first five when checked against the raw events, the sixth when checked against how the benchmark grades a run.
- [A conclusion drawn early] With 82 of 200 runs in, v2’s extra time was put down to its agents polling their jobs instead of using
Monitor. With all the runs in, most of the extra waiting sat on one task, and the slowdown as a whole was not significant against v2’s own baseline. - [A classifier that matched too much] v2’s extra tool time was then put down to waiting on long-running jobs. But the command classifier had counted every trailing
waitas waiting, even in parallel batches of the agents’ own programs (cmd & cmd & wait). Corrected, most of the extra tool time went to running or awaiting the agents’ own searches, sweeps and re-checks. - [A rule generalized from three tasks] “No wait on a background job outlasted the job by more than about 20 seconds” held on the first three tasks examined. But on
pretrain-shard-corruption, one baseline run lost 9.4 minutes to a polling loop that outlived its job. - [A number read without its timing] A baseline run on
pretrain-shard-corruptionwas said to have sat idle for 36 minutes between background-job wakes. The 36 minutes came after the run’s final answer, while a leftover poller held the session open. - [A log read at face value] An earlier analysis found that, on the tuning tasks, baseline’s agents ended a turn to wait for a notice in 5 of their 50 runs, and v2.1’s agents in none. The difference in idle time was not statistically significant. Checking the raw events found two faults that pulled the count in opposite directions:
- [Interruptions counted as idle] Sessions cut off by an API error or a host restart had been counted as idle. Excluding them lowered the count from 5 to 3.
- [Turns hidden by subagents] Turns that ended while subagents worked in the background had been missed, as Claude Code logs a turn’s end only once those subagents finish. Counting these turns raised the count from 3 to 6.
With both faults fixed, baseline’s agents went idle in 6 of their 50 runs, and the difference in idle time is statistically significant.
- [A bar set above the tests] Claude Code made an incorrect assertion: “Passing did not always mean correct,” citing supposed slips in passing runs of both arms that the tests happened not to catch. But a task’s tests define what passing means. In calling these slips, Claude Code extrapolated the grading beyond what the benchmark specifies, from its own reading of each task:
- [CAD platforms] Two passing runs ended the part’s platforms 1.5 mm past the bore, so that their corners poked 0.8 mm out of the outer wall, adding 44 mm³ (0.05%) to its volume. Both still scored in full.
- [Cipher crackers] Rebuilt and fed inputs of 1 to 15 letters, three passing crackers crashed on short ones: two at 5 letters or fewer, the third at 4 or fewer. The test’s input has 10 letters.
Slips also recur. A later iteration read v2’s extra waiting per run as most of its extra wall time, repeating the first slip, when one task carried that average (Appendix B.2).